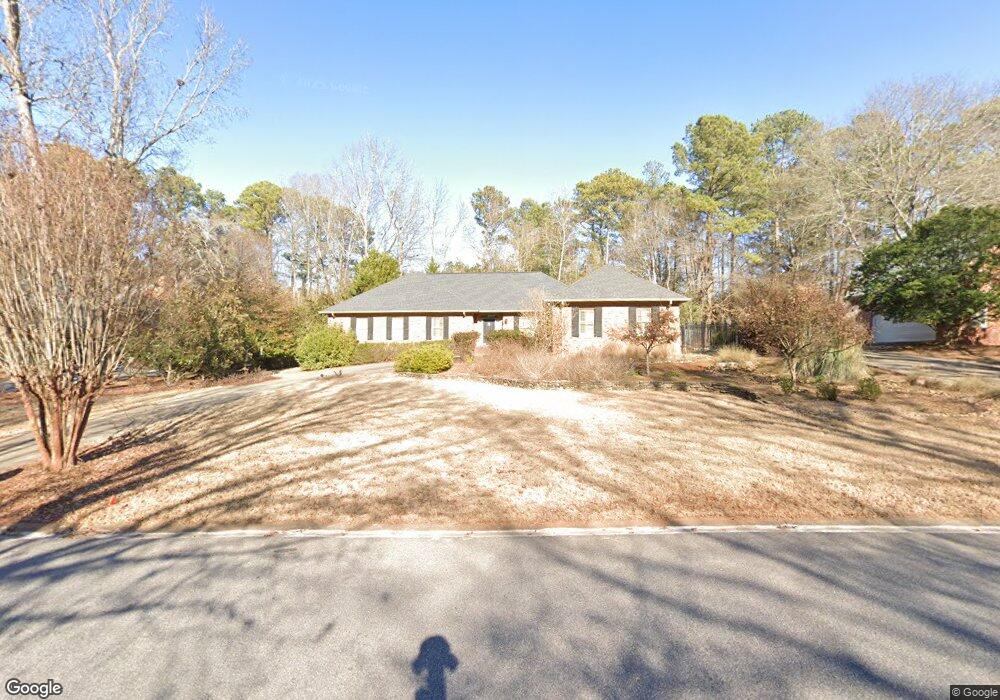
120 High Ridge Dr Athens, GA 30606
Estimated Value: $493,796 - $538,000
3
Beds
2
Baths
2,415
Sq Ft
$214/Sq Ft
Est. Value
About This Home
This home is located at 120 High Ridge Dr, Athens, GA 30606 and is currently estimated at $515,949, approximately $213 per square foot. 120 High Ridge Dr is a home located in Clarke County with nearby schools including Timothy Elementary School, Clarke Middle School, and Clarke Central High School.
Ownership History
Date
Name
Owned For
Owner Type
Purchase Details
Closed on
Oct 18, 2018
Sold by
Peacock Agnew
Bought by
Hopkins Jill Beckett and Hopkins Mark Stephen
Current Estimated Value
Purchase Details
Closed on
Oct 22, 2015
Sold by
Shelton Kristy K
Bought by
Peacock Agnew
Purchase Details
Closed on
Feb 11, 2009
Sold by
Lenz Carlton
Bought by
Shelton Kristy K
Home Financials for this Owner
Home Financials are based on the most recent Mortgage that was taken out on this home.
Original Mortgage
$220,950
Interest Rate
5.03%
Mortgage Type
New Conventional
Purchase Details
Closed on
Mar 11, 1998
Sold by
Neislar Ron and Neislar Wanda H
Bought by
Lenz Eleanor Martha and Lenz Carlton C
Purchase Details
Closed on
Jun 26, 1995
Sold by
Rivers Thurman and Ruth Rivers F
Bought by
Neislar Ron and Neislar Wanda H
Purchase Details
Closed on
Dec 19, 1989
Sold by
Vandette Paul D and Vandette Jacqueline F
Bought by
Rivers Thurman and Ruth Rivers F
Create a Home Valuation Report for This Property
The Home Valuation Report is an in-depth analysis detailing your home's value as well as a comparison with similar homes in the area
Home Values in the Area
Average Home Value in this Area
Purchase History
| Date | Buyer | Sale Price | Title Company |
|---|---|---|---|
| Hopkins Jill Beckett | $375,000 | -- | |
| Peacock Agnew | $285,000 | -- | |
| Shelton Kristy K | $245,500 | -- | |
| Lenz Eleanor Martha | -- | -- | |
| Neislar Ron | $130,000 | -- | |
| Rivers Thurman | $131,200 | -- |
Source: Public Records
Mortgage History
| Date | Status | Borrower | Loan Amount |
|---|---|---|---|
| Previous Owner | Shelton Kristy K | $220,950 |
Source: Public Records
Tax History Compared to Growth
Tax History
| Year | Tax Paid | Tax Assessment Tax Assessment Total Assessment is a certain percentage of the fair market value that is determined by local assessors to be the total taxable value of land and additions on the property. | Land | Improvement |
|---|---|---|---|---|
| 2025 | $4,782 | $199,814 | $20,000 | $179,814 |
| 2024 | $4,782 | $194,890 | $20,000 | $174,890 |
| 2023 | $4,816 | $187,758 | $20,000 | $167,758 |
| 2022 | $4,584 | $153,687 | $20,000 | $133,687 |
| 2021 | $4,127 | $132,455 | $20,000 | $112,455 |
| 2020 | $4,042 | $129,946 | $20,000 | $109,946 |
| 2019 | $3,981 | $127,251 | $20,000 | $107,251 |
| 2018 | $3,120 | $113,041 | $20,000 | $93,041 |
| 2017 | $2,970 | $102,251 | $20,000 | $82,251 |
| 2016 | $2,953 | $101,076 | $20,000 | $81,076 |
| 2015 | $2,861 | $94,134 | $20,000 | $74,134 |
| 2014 | $2,828 | $93,029 | $20,000 | $73,029 |
Source: Public Records
Map
Nearby Homes
- 134 Bent Tree Dr
- 164 Lucy Ln
- 184 Hillsborough Dr
- 125 Mitchell Bluff
- 124 Pin Oak Ct
- 115 Woodhaven St
- 860 Mitchell Bridge Rd Unit 8
- 860 Mitchell Bridge Rd Unit 8
- 43 River Shoals Dr
- 225 Sherwood Dr
- 450 River Bottom Rd
- 150 The Preserve Dr Unit H2
- 275 Westchester Cir
- 205 Tremont Cir
- 809 Forest Heights Dr
- 575 Vaughn Rd
- 377 Chalfont Dr
- 130 High Ridge Dr
- 110 High Ridge Dr
- 125 High Ridge Dr
- 115 High Ridge Dr
- 100 High Ridge Dr
- 135 High Ridge Dr
- 150 High Ridge Dr
- 150 High Ridge Dr Unit 1
- 145 High Ridge Dr
- 105 High Ridge Dr
- 126 Woodhaven Cir
- 136 Woodhaven Cir
- 160 High Ridge Dr
- 123 Bent Tree Dr
- 124 Bent Tree Dr
- 120 Woodhaven Cir
- 743 Mitchell Bridge Rd Unit B9
- 743 Mitchell Bridge Rd
- 747 Mitchell Bridge Rd Unit B10
- 747 Mitchell Bridge Rd