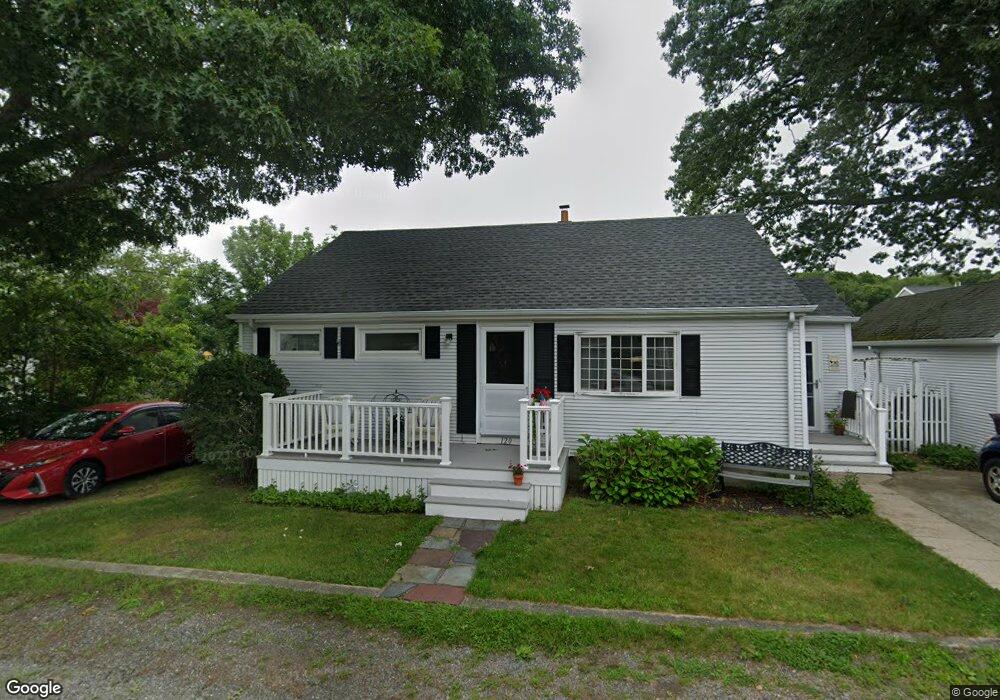
120 James St Acushnet, MA 02743
Estimated Value: $382,333 - $445,000
2
Beds
1
Bath
948
Sq Ft
$436/Sq Ft
Est. Value
About This Home
This home is located at 120 James St, Acushnet, MA 02743 and is currently estimated at $413,083, approximately $435 per square foot. 120 James St is a home located in Bristol County with nearby schools including Acushnet Elementary School, Albert F Ford Middle School, and Alma Del Mar Charter School.
Ownership History
Date
Name
Owned For
Owner Type
Purchase Details
Closed on
Dec 3, 2014
Sold by
Richard James R and Richard Barbara L
Bought by
Richard James R and Richard Barbara L
Current Estimated Value
Purchase Details
Closed on
May 27, 1988
Sold by
Lapalme Mary R Est
Bought by
Richard James R
Home Financials for this Owner
Home Financials are based on the most recent Mortgage that was taken out on this home.
Original Mortgage
$81,000
Interest Rate
10.18%
Mortgage Type
Purchase Money Mortgage
Create a Home Valuation Report for This Property
The Home Valuation Report is an in-depth analysis detailing your home's value as well as a comparison with similar homes in the area
Home Values in the Area
Average Home Value in this Area
Purchase History
| Date | Buyer | Sale Price | Title Company |
|---|---|---|---|
| Richard James R | -- | -- | |
| Richard James R | $106,000 | -- |
Source: Public Records
Mortgage History
| Date | Status | Borrower | Loan Amount |
|---|---|---|---|
| Previous Owner | Richard James R | $25,000 | |
| Previous Owner | Richard James R | $77,600 | |
| Previous Owner | Richard James R | $10,000 | |
| Previous Owner | Richard James R | $81,000 |
Source: Public Records
Tax History
| Year | Tax Paid | Tax Assessment Tax Assessment Total Assessment is a certain percentage of the fair market value that is determined by local assessors to be the total taxable value of land and additions on the property. | Land | Improvement |
|---|---|---|---|---|
| 2025 | $36 | $331,100 | $96,800 | $234,300 |
| 2024 | $3,414 | $299,200 | $92,600 | $206,600 |
| 2023 | $3,311 | $275,900 | $84,200 | $191,700 |
| 2022 | $3,298 | $248,500 | $80,000 | $168,500 |
| 2021 | $8,155 | $227,800 | $80,000 | $147,800 |
| 2020 | $3,176 | $227,800 | $80,000 | $147,800 |
| 2019 | $3,095 | $218,300 | $80,000 | $138,300 |
| 2018 | $2,701 | $207,200 | $80,000 | $127,200 |
| 2017 | $2,560 | $199,200 | $80,000 | $119,200 |
| 2016 | $2,796 | $192,400 | $80,000 | $112,400 |
| 2015 | $2,649 | $185,500 | $80,000 | $105,500 |
Source: Public Records
Map
Nearby Homes
Your Personal Tour Guide
Ask me questions while you tour the home.