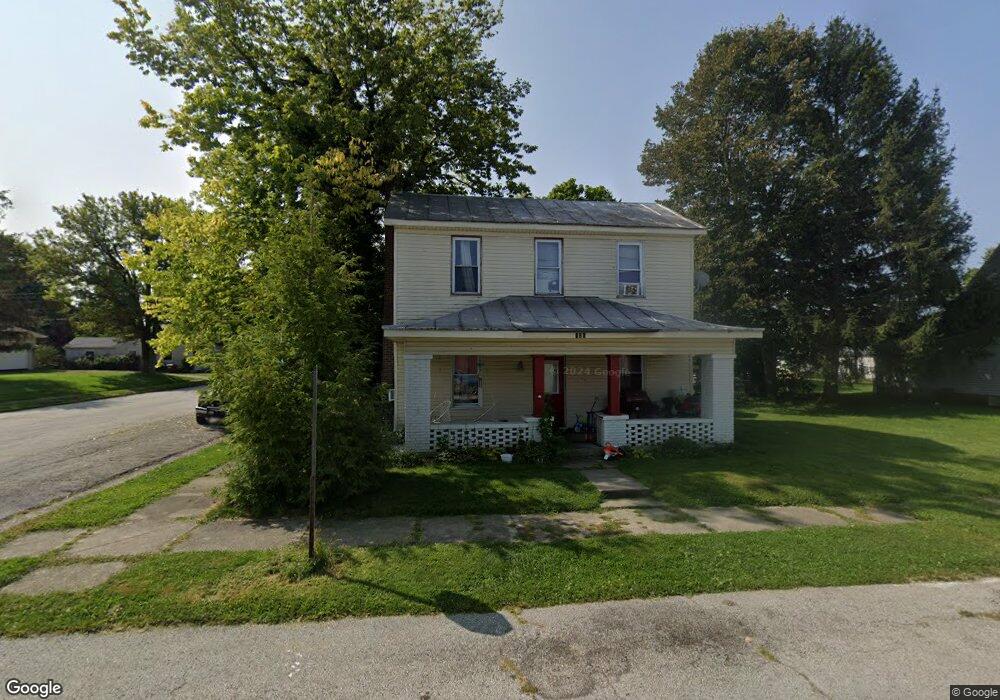
120 Jefferson St West Manchester, OH 45382
Estimated Value: $132,393 - $246,000
3
Beds
1
Bath
1,997
Sq Ft
$85/Sq Ft
Est. Value
About This Home
This home is located at 120 Jefferson St, West Manchester, OH 45382 and is currently estimated at $170,098, approximately $85 per square foot. 120 Jefferson St is a home located in Preble County with nearby schools including National Trail Elementary School, National Trail Middle School, and National Trail High School.
Ownership History
Date
Name
Owned For
Owner Type
Purchase Details
Closed on
Jun 4, 2018
Sold by
Jordan Margaret J
Bought by
Kelly Sean
Current Estimated Value
Purchase Details
Closed on
Sep 27, 2016
Sold by
Newport Jason R
Bought by
Jordan Margaret J
Purchase Details
Closed on
Feb 29, 2000
Sold by
Kemp Sonja
Bought by
Newport Jason R
Home Financials for this Owner
Home Financials are based on the most recent Mortgage that was taken out on this home.
Original Mortgage
$30,125
Interest Rate
8.21%
Mortgage Type
New Conventional
Purchase Details
Closed on
Jun 16, 1999
Sold by
Roark Rex
Bought by
Kemp Samuel S and Kemp Sonja R
Purchase Details
Closed on
Apr 5, 1999
Sold by
Thomas Bernard M
Bought by
Roark Rex
Purchase Details
Closed on
Oct 2, 1996
Sold by
Reynolds W Eldridge
Bought by
Thomas Bernard M and Thomas Linda
Home Financials for this Owner
Home Financials are based on the most recent Mortgage that was taken out on this home.
Original Mortgage
$48,000
Interest Rate
8%
Mortgage Type
New Conventional
Create a Home Valuation Report for This Property
The Home Valuation Report is an in-depth analysis detailing your home's value as well as a comparison with similar homes in the area
Home Values in the Area
Average Home Value in this Area
Purchase History
| Date | Buyer | Sale Price | Title Company |
|---|---|---|---|
| Kelly Sean | -- | Freedom Title Company | |
| Jordan Margaret J | $10,000 | Freedom Title Company | |
| Newport Jason R | $47,250 | -- | |
| Kemp Samuel S | $36,000 | -- | |
| Roark Rex | $20,000 | -- | |
| Thomas Bernard M | $38,000 | -- |
Source: Public Records
Mortgage History
| Date | Status | Borrower | Loan Amount |
|---|---|---|---|
| Previous Owner | Newport Jason R | $30,125 | |
| Previous Owner | Thomas Bernard M | $48,000 |
Source: Public Records
Tax History Compared to Growth
Tax History
| Year | Tax Paid | Tax Assessment Tax Assessment Total Assessment is a certain percentage of the fair market value that is determined by local assessors to be the total taxable value of land and additions on the property. | Land | Improvement |
|---|---|---|---|---|
| 2024 | $1,239 | $30,350 | $4,730 | $25,620 |
| 2023 | $1,239 | $30,350 | $4,730 | $25,620 |
| 2022 | $1,029 | $21,460 | $3,500 | $17,960 |
| 2021 | $1,075 | $21,460 | $3,500 | $17,960 |
| 2020 | $966 | $21,460 | $3,500 | $17,960 |
| 2019 | $1,384 | $18,760 | $3,150 | $15,610 |
| 2018 | $830 | $18,760 | $3,150 | $15,610 |
| 2017 | $729 | $18,760 | $3,150 | $15,610 |
| 2016 | $700 | $16,840 | $3,150 | $13,690 |
| 2014 | $700 | $16,840 | $3,150 | $13,690 |
| 2013 | $746 | $16,835 | $3,150 | $13,685 |
Source: Public Records
Map
Nearby Homes
- 383 Georgetown Verona Rd
- 0 E Scott Unit 942470
- 792 W Holtzmuller Rd
- 230 Stephens Rd
- 246 N Main St
- 8486 Us Route 127
- 210 N Main St
- 501 N Maple St
- 0 W US 40
- 9923 Euphemia Castine Rd
- 10995 Rockridge Rd
- 2892 Swishers Mill Rd
- 0 Friday Rd
- 2294 U S 40
- 6254 State Route 722
- 7337 E Lock Rd
- 6806 Darke-Preble County Line Rd
- 693 Friday Rd
- 140 State Route 503
- 0 Ohio 722 Unit 10051560
- 112 E Jefferson St
- 214 S High St
- 200 E Jefferson St
- 110 Jefferson St
- 110 Jefferson St
- 220 S High St
- 215 S High St
- 238 Jefferson St
- 226 Jefferson St
- 218 Jefferson St
- 206 Jefferson St
- 201 S Main St
- 110 E Scott St
- 110 E Scott St
- 211 S Main St
- 212 Jefferson St
- 115 Scott St
- 211 Maple St
- 211 Maple St
- 115 E Scott St