Estimated Value: $166,928 - $195,000
--
Bed
1
Bath
1,396
Sq Ft
$127/Sq Ft
Est. Value
About This Home
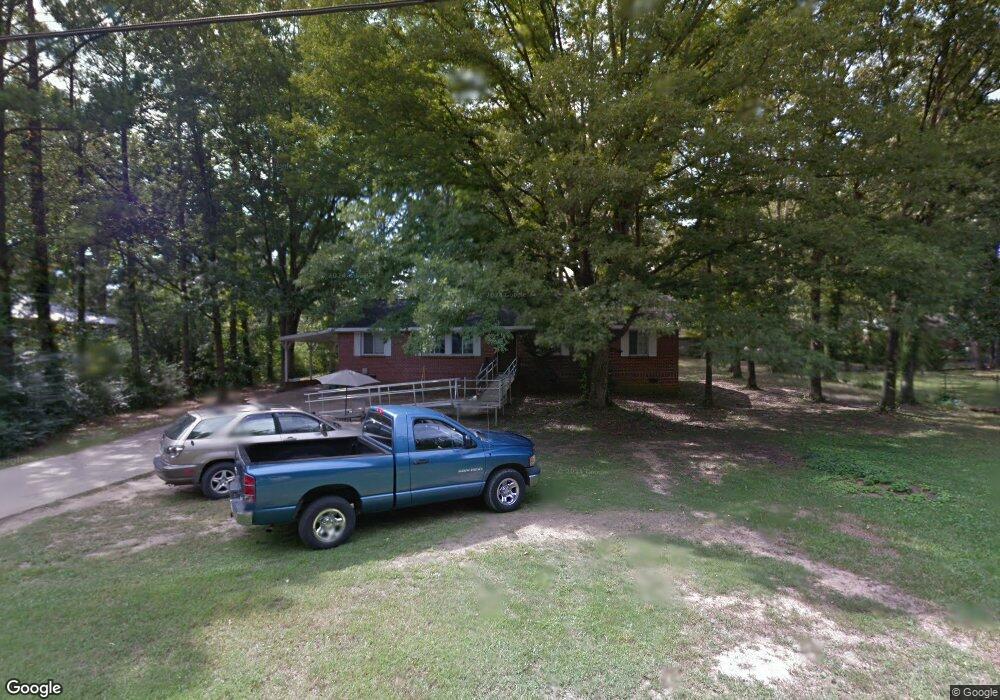
This home is located at 120 John Ross Dr SW, Rome, GA 30165 and is currently estimated at $177,482, approximately $127 per square foot. 120 John Ross Dr SW is a home located in Floyd County with nearby schools including Rome High School.
Ownership History
Date
Name
Owned For
Owner Type
Purchase Details
Closed on
Mar 27, 2018
Sold by
Givens James M
Bought by
Felipe Josue Angel
Current Estimated Value
Home Financials for this Owner
Home Financials are based on the most recent Mortgage that was taken out on this home.
Original Mortgage
$75,000
Outstanding Balance
$44,070
Interest Rate
4.43%
Mortgage Type
New Conventional
Estimated Equity
$133,412
Purchase Details
Closed on
Oct 5, 2006
Sold by
Not Provided
Bought by
Givens James M
Purchase Details
Closed on
Mar 7, 2006
Sold by
Not Provided
Bought by
Givens James M
Home Financials for this Owner
Home Financials are based on the most recent Mortgage that was taken out on this home.
Original Mortgage
$66,416
Interest Rate
6.23%
Mortgage Type
New Conventional
Purchase Details
Closed on
Nov 29, 2005
Sold by
Givens James M
Bought by
Newman David and Newman Jeannie Newman
Home Financials for this Owner
Home Financials are based on the most recent Mortgage that was taken out on this home.
Original Mortgage
$66,416
Interest Rate
6.23%
Mortgage Type
New Conventional
Purchase Details
Closed on
Oct 20, 2005
Sold by
West James Russell
Bought by
Givens James M
Home Financials for this Owner
Home Financials are based on the most recent Mortgage that was taken out on this home.
Original Mortgage
$66,416
Interest Rate
6.23%
Mortgage Type
New Conventional
Create a Home Valuation Report for This Property
The Home Valuation Report is an in-depth analysis detailing your home's value as well as a comparison with similar homes in the area
Home Values in the Area
Average Home Value in this Area
Purchase History
| Date | Buyer | Sale Price | Title Company |
|---|---|---|---|
| Felipe Josue Angel | $95,000 | -- | |
| Givens James M | $97,000 | -- | |
| Givens James M | $65,000 | -- | |
| Newman David | $65,000 | -- | |
| Givens James M | $45,000 | -- |
Source: Public Records
Mortgage History
| Date | Status | Borrower | Loan Amount |
|---|---|---|---|
| Open | Felipe Josue Angel | $75,000 | |
| Previous Owner | Givens James M | $66,416 | |
| Previous Owner | Newman David | $66,416 |
Source: Public Records
Tax History Compared to Growth
Tax History
| Year | Tax Paid | Tax Assessment Tax Assessment Total Assessment is a certain percentage of the fair market value that is determined by local assessors to be the total taxable value of land and additions on the property. | Land | Improvement |
|---|---|---|---|---|
| 2024 | $2,357 | $60,512 | $15,376 | $45,136 |
| 2023 | $2,143 | $57,064 | $13,888 | $43,176 |
| 2022 | $1,707 | $46,772 | $11,408 | $35,364 |
| 2021 | $1,473 | $39,708 | $11,408 | $28,300 |
| 2020 | $1,318 | $35,216 | $8,680 | $26,536 |
| 2019 | $1,238 | $33,452 | $8,680 | $24,772 |
| 2018 | $1,099 | $29,702 | $8,680 | $21,022 |
| 2017 | $1,079 | $29,137 | $8,680 | $20,457 |
| 2016 | $1,202 | $32,360 | $8,680 | $23,680 |
| 2015 | $1,184 | $32,800 | $8,680 | $24,120 |
| 2014 | $1,184 | $33,774 | $8,680 | $25,094 |
Source: Public Records
Map
Nearby Homes
- 216 Coosawattee Ave SW
- 25 Ridge Dr SW
- 200 Coosawattee Ave SW
- 5 Ridge Dr SW
- 3 Oak Ridge Ct NE
- 43 Westwood Cir SW
- 15 John Ross Dr SW
- 3 Lovell Ln SW
- 209 Larkspur Ln SW
- 0 Cedartown Rd Unit 10479932
- 111 Deerbrook Dr SW
- 16 Jefferson Dr SW
- 0 Westlyn Dr Unit 10599621
- 0 Westlyn Dr Unit 7645405
- 0 Lovell Ln Unit 7662536
- 0 Lovell Ln Unit 10620627
- 0 Brookvalley Ct SW Unit 10444714
- 0 Brookvalley Ct SW Unit 7512814
- 106 Coker Dr SW
- 4 Belmont Dr SW
- 122 John Ross Dr SW
- 118 John Ross Dr SW
- 221 Coosawattee Ave SW
- 223 Coosawattee Ave SW
- 219 Coosawattee Ave SW
- 124 John Ross Dr SW
- 116 John Ross Dr SW
- 225 Coosawattee Ave SW
- 123 John Ross Dr SW
- 121 John Ross Dr SW
- 217 Coosawattee Ave SW
- 127 John Ross Dr SW
- 117 John Ross Dr SW
- 227 Coosawattee Ave SW
- 114 John Ross Dr SW
- 126 John Ross Dr SW
- 215 Coosawattee Ave SW
- 113 John Ross Dr SW
- 222 Coosawattee Ave SW
- 229 Coosawattee Ave SW