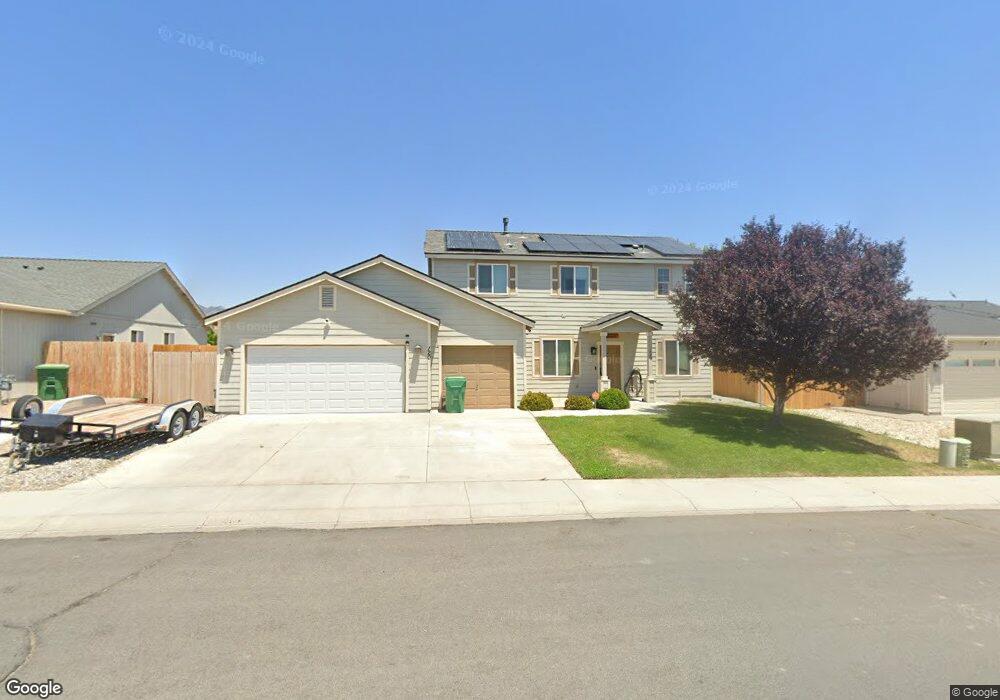
120 Knickerbocker Cir Dayton, NV 89403
Estimated Value: $467,000 - $526,000
5
Beds
3
Baths
2,311
Sq Ft
$211/Sq Ft
Est. Value
About This Home
This home is located at 120 Knickerbocker Cir, Dayton, NV 89403 and is currently estimated at $488,389, approximately $211 per square foot. 120 Knickerbocker Cir is a home located in Lyon County with nearby schools including Sutro Elementary School, Dayton Intermediate School, and Dayton High School.
Ownership History
Date
Name
Owned For
Owner Type
Purchase Details
Closed on
Aug 7, 2017
Sold by
Hefner Caitiin
Bought by
Hefner John
Current Estimated Value
Home Financials for this Owner
Home Financials are based on the most recent Mortgage that was taken out on this home.
Original Mortgage
$308,867
Outstanding Balance
$257,167
Interest Rate
3.88%
Mortgage Type
VA
Estimated Equity
$231,222
Purchase Details
Closed on
Mar 11, 2014
Sold by
Ovard Brady S and Ovard Kaitlyn E
Bought by
Miller Darin D and Miller Diane R
Home Financials for this Owner
Home Financials are based on the most recent Mortgage that was taken out on this home.
Original Mortgage
$193,877
Interest Rate
4.34%
Mortgage Type
New Conventional
Purchase Details
Closed on
Aug 1, 2011
Sold by
Steven L Obrien Llc and Obrien Steven L
Bought by
Ovard Brady S and Ovard Kaithlyn E
Home Financials for this Owner
Home Financials are based on the most recent Mortgage that was taken out on this home.
Original Mortgage
$136,353
Interest Rate
4.75%
Mortgage Type
FHA
Purchase Details
Closed on
May 27, 2011
Sold by
Meza Angel L
Bought by
Obrien Steven L
Create a Home Valuation Report for This Property
The Home Valuation Report is an in-depth analysis detailing your home's value as well as a comparison with similar homes in the area
Home Values in the Area
Average Home Value in this Area
Purchase History
| Date | Buyer | Sale Price | Title Company |
|---|---|---|---|
| Hefner John | -- | Western Title Co | |
| Hefner John | $299,000 | Western Title Co | |
| Miller Darin D | $190,000 | Western Title Co | |
| Ovard Brady S | $139,900 | Western Title Company | |
| Obrien Steven L | $99,100 | Western Title Co |
Source: Public Records
Mortgage History
| Date | Status | Borrower | Loan Amount |
|---|---|---|---|
| Open | Hefner John | $308,867 | |
| Previous Owner | Miller Darin D | $193,877 | |
| Previous Owner | Ovard Brady S | $136,353 |
Source: Public Records
Tax History
| Year | Tax Paid | Tax Assessment Tax Assessment Total Assessment is a certain percentage of the fair market value that is determined by local assessors to be the total taxable value of land and additions on the property. | Land | Improvement |
|---|---|---|---|---|
| 2025 | $2,770 | $132,791 | $57,750 | $75,041 |
| 2024 | $2,564 | $133,103 | $57,750 | $75,353 |
| 2023 | $2,564 | $128,394 | $57,750 | $70,644 |
| 2022 | $1,925 | $113,271 | $48,090 | $65,181 |
| 2021 | $1,783 | $107,352 | $43,785 | $63,567 |
| 2020 | $1,650 | $104,610 | $43,790 | $60,820 |
| 2019 | $1,547 | $87,833 | $29,190 | $58,643 |
| 2018 | $1,473 | $78,252 | $21,000 | $57,252 |
| 2017 | $1,414 | $71,228 | $14,000 | $57,228 |
| 2016 | $1,378 | $60,586 | $7,880 | $52,706 |
| 2015 | $1,375 | $46,693 | $7,880 | $38,813 |
| 2014 | $1,335 | $41,818 | $7,880 | $33,938 |
Source: Public Records
Map
Nearby Homes
- 708 Grubbs Well Trail
- 187 Dayton Village Pkwy
- 539 Rawe Peak Dr
- 1115 Gold Crater Place Unit Homesite 8
- 1115 Gold Crater Place
- 201 Crown Point Dr
- 522 Sugarloaf Dr
- 334 Monte Cristo Dr
- 629 Westwinds Dr
- 404 Schell Creek Dr
- 430 Crosswinds Dr
- 737 Butte Creek Rd
- 698 Canon Rd Unit Homesite 14
- 590 Union Rd Unit Homesite 53
- 101 Southend Dr
- 209 Corral Dr
- 720 Butte Creek Rd
- 498 Russell Rd Unit Homesite 91
- 594 Union Rd
- 594 Union Rd Unit Homesite 55
- 120 Knickerbocker Dr
- 122 Knickerbocker Dr
- 122 Knickerbocker Cir
- 118 Knickerbocker Dr
- 124 Knickerbocker Dr
- 124 Knickerbocker Cir
- 116 Knickerbocker Cir
- 119 Knickerbocker Dr
- 121 Knickerbocker Dr
- 121 Knickerbocker Cir
- 116 Knickerbocker Dr
- 117 Knickerbocker Dr
- 123 Knickerbocker Dr
- 126 Knickerbocker Dr
- 114 Knickerbocker Dr
- 204 Harkin Cir
- 216 Harkin Cir
- 202 Harkin Cir
- 206 Harkin Cir
- 128 Knickerbocker Dr
Your Personal Tour Guide
Ask me questions while you tour the home.