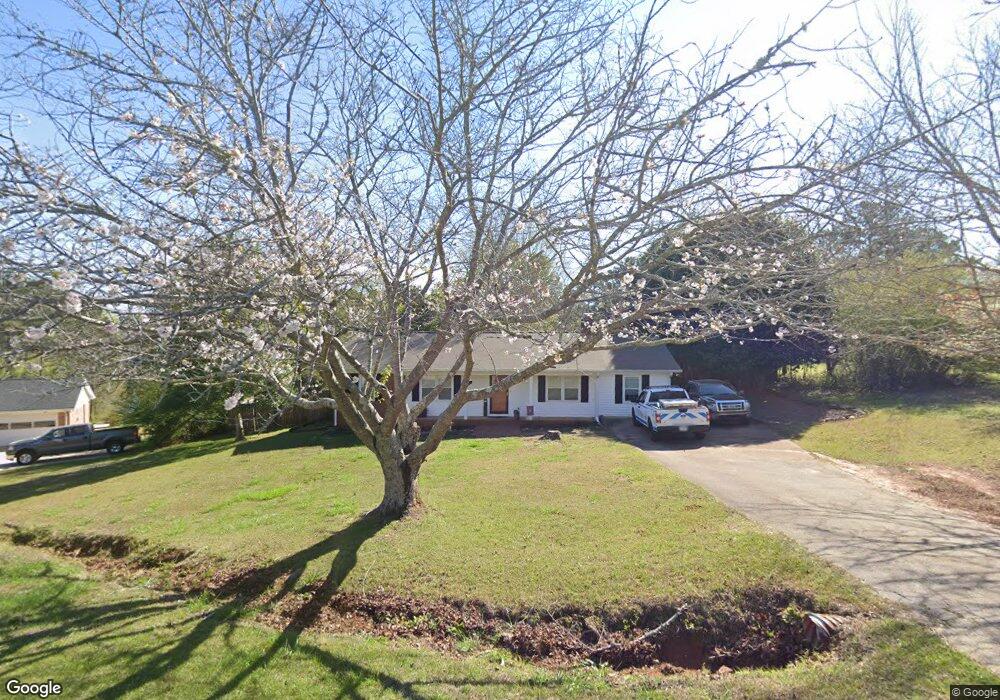
120 Lakecrest Dr Lagrange, GA 30240
Estimated Value: $218,000 - $263,000
3
Beds
2
Baths
1,527
Sq Ft
$154/Sq Ft
Est. Value
About This Home
This home is located at 120 Lakecrest Dr, Lagrange, GA 30240 and is currently estimated at $235,074, approximately $153 per square foot. 120 Lakecrest Dr is a home located in Troup County with nearby schools including Long Cane Elementary School, Berta Weathersbee Elementary School, and Whitesville Road Elementary School.
Ownership History
Date
Name
Owned For
Owner Type
Purchase Details
Closed on
Aug 31, 2020
Sold by
Melson Brandon S
Bought by
Mccurry Carl B
Current Estimated Value
Home Financials for this Owner
Home Financials are based on the most recent Mortgage that was taken out on this home.
Original Mortgage
$132,456
Outstanding Balance
$117,546
Interest Rate
2.9%
Mortgage Type
FHA
Estimated Equity
$117,528
Purchase Details
Closed on
Nov 10, 2017
Sold by
Bittick Newton Haygood
Bought by
Melson Brandon S and Melson Jessica E
Purchase Details
Closed on
May 30, 1980
Sold by
Blankenship Dennis R and Blankenship Cynthia
Bought by
Bittick Newton H
Purchase Details
Closed on
Nov 7, 1977
Sold by
Knight & Knight Of Laginc
Bought by
Blankenship Dennis R and Blankenship Cynthia
Purchase Details
Closed on
Jan 6, 1977
Sold by
Whitaker Homes Inc
Bought by
Knight & Knight Of Laginc
Purchase Details
Closed on
Dec 8, 1975
Sold by
T and Properties,Ltd C
Bought by
Whitaker Homes Inc
Create a Home Valuation Report for This Property
The Home Valuation Report is an in-depth analysis detailing your home's value as well as a comparison with similar homes in the area
Home Values in the Area
Average Home Value in this Area
Purchase History
| Date | Buyer | Sale Price | Title Company |
|---|---|---|---|
| Mccurry Carl B | $134,900 | -- | |
| Melson Brandon S | $109,000 | -- | |
| Bittick Newton H | $10,100 | -- | |
| Blankenship Dennis R | $38,000 | -- | |
| Knight & Knight Of Laginc | -- | -- | |
| Whitaker Homes Inc | -- | -- |
Source: Public Records
Mortgage History
| Date | Status | Borrower | Loan Amount |
|---|---|---|---|
| Open | Mccurry Carl B | $132,456 |
Source: Public Records
Tax History Compared to Growth
Tax History
| Year | Tax Paid | Tax Assessment Tax Assessment Total Assessment is a certain percentage of the fair market value that is determined by local assessors to be the total taxable value of land and additions on the property. | Land | Improvement |
|---|---|---|---|---|
| 2024 | $1,540 | $56,480 | $10,560 | $45,920 |
| 2023 | $1,532 | $56,160 | $10,560 | $45,600 |
| 2022 | $1,473 | $52,760 | $10,560 | $42,200 |
| 2021 | $1,566 | $51,920 | $10,560 | $41,360 |
| 2020 | $1,385 | $45,920 | $10,560 | $35,360 |
| 2019 | $1,119 | $37,108 | $6,748 | $30,360 |
| 2018 | $1,036 | $34,348 | $6,748 | $27,600 |
| 2017 | $976 | $34,348 | $6,748 | $27,600 |
| 2016 | $976 | $34,351 | $6,748 | $27,603 |
| 2015 | $978 | $34,351 | $6,748 | $27,603 |
| 2014 | $936 | $32,898 | $6,748 | $26,150 |
| 2013 | -- | $35,009 | $6,748 | $28,261 |
Source: Public Records
Map
Nearby Homes
- 100 Huntcliff Ct
- 141 Plymouth Dr
- 110 Hawthorne Cir
- 124 Foxdale Dr
- 135 Planters Ridge Dr
- 105 Hawthorne Cir
- 103 Hawthorne Cir
- 119 Plymouth Dr
- 102 Franklin Place
- 190 Hill Rd
- 101 Ivy Springs Dr
- 687 Glass Bridge Rd
- 474 Newton Rd
- 40 River Point Dr
- 0 Deming St Unit 10550189
- 509 Connie Dr
- 883 Vernon Ferry Rd
- 808 S Fling Rd
- 205 Linda Ln
- 709 Vernon Ferry Rd
- 118 Lakecrest Dr
- 122 Lakecrest Dr
- 123 Lakecrest Dr
- 124 Lakecrest Dr
- 119 Lakecrest Dr
- 121 Lakecrest Dr
- 116 Lakecrest Dr
- 117 Lakecrest Dr
- 204 Lakecrest Ct
- 203 Lakecrest Ct Unit 9
- 115 Lakecrest Dr
- 106 Lakecrest Dr
- 201 Lakecrest Ct
- 113 Lakecrest Dr
- 202 Lakecrest Ct
- 725 Teaver Rd
- 743 Teaver Rd
- 111 Lakecrest Dr
- 755 Teaver Rd
- 109 Lakecrest Dr