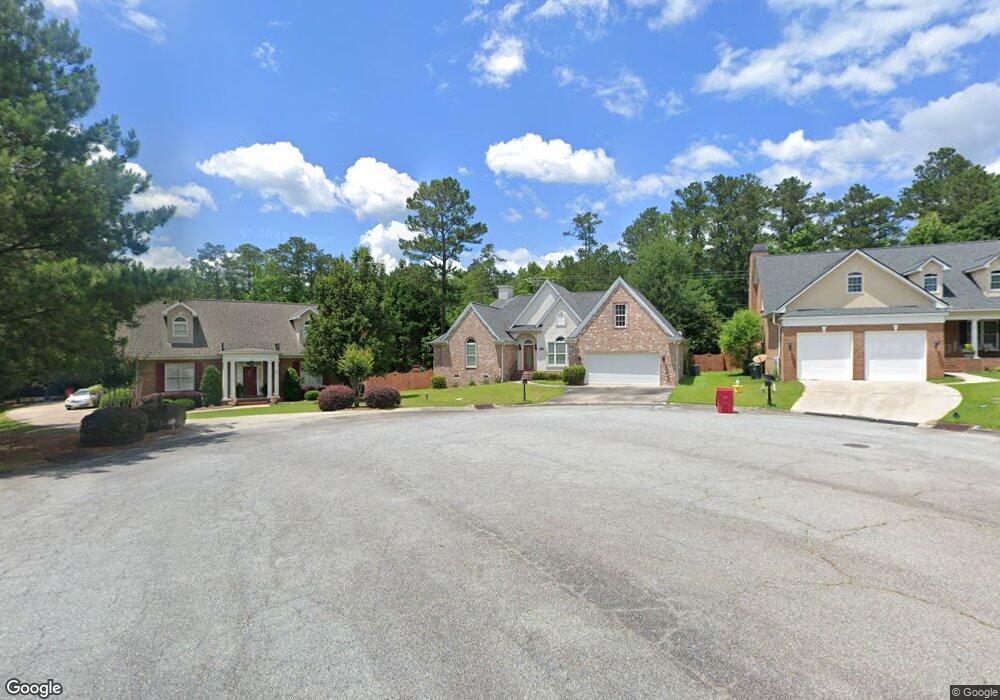
120 Legare Ct Macon, GA 31210
Estimated Value: $302,000 - $348,000
4
Beds
3
Baths
2,450
Sq Ft
$133/Sq Ft
Est. Value
About This Home
This home is located at 120 Legare Ct, Macon, GA 31210 and is currently estimated at $326,891, approximately $133 per square foot. 120 Legare Ct is a home located in Bibb County with nearby schools including Carter Elementary School, Howard Middle School, and Howard High School.
Ownership History
Date
Name
Owned For
Owner Type
Purchase Details
Closed on
Aug 23, 2010
Sold by
Fleming Rebecca L
Bought by
Williams Florence M
Current Estimated Value
Purchase Details
Closed on
Jul 5, 2007
Sold by
Jackson Lee Enterprises Llc
Bought by
Fleming Rebecca L
Home Financials for this Owner
Home Financials are based on the most recent Mortgage that was taken out on this home.
Original Mortgage
$198,000
Interest Rate
6.52%
Mortgage Type
Purchase Money Mortgage
Purchase Details
Closed on
Dec 15, 2006
Sold by
Gardner Investment Company Llc
Bought by
Jackson Lee Enterprises L L C
Purchase Details
Closed on
Aug 25, 2006
Sold by
Jones Central Llc
Bought by
Gardner Investment Company Llc
Purchase Details
Closed on
Aug 5, 2003
Purchase Details
Closed on
May 23, 2003
Create a Home Valuation Report for This Property
The Home Valuation Report is an in-depth analysis detailing your home's value as well as a comparison with similar homes in the area
Home Values in the Area
Average Home Value in this Area
Purchase History
| Date | Buyer | Sale Price | Title Company |
|---|---|---|---|
| Williams Florence M | $250,000 | None Available | |
| Fleming Rebecca L | $247,500 | None Available | |
| Jackson Lee Enterprises L L C | $32,500 | None Available | |
| Gardner Investment Company Llc | $20,000 | None Avelable | |
| -- | $305,000 | -- | |
| -- | -- | -- |
Source: Public Records
Mortgage History
| Date | Status | Borrower | Loan Amount |
|---|---|---|---|
| Previous Owner | Fleming Rebecca L | $198,000 |
Source: Public Records
Tax History Compared to Growth
Tax History
| Year | Tax Paid | Tax Assessment Tax Assessment Total Assessment is a certain percentage of the fair market value that is determined by local assessors to be the total taxable value of land and additions on the property. | Land | Improvement |
|---|---|---|---|---|
| 2025 | $2,938 | $126,568 | $11,600 | $114,968 |
| 2024 | $2,663 | $111,843 | $10,400 | $101,443 |
| 2023 | $2,145 | $109,443 | $8,000 | $101,443 |
| 2022 | $3,539 | $109,230 | $8,820 | $100,410 |
| 2021 | $3,728 | $105,115 | $8,820 | $96,295 |
| 2020 | $3,409 | $94,818 | $8,400 | $86,418 |
| 2019 | $3,584 | $98,546 | $8,400 | $90,146 |
| 2018 | $5,384 | $93,802 | $8,400 | $85,402 |
| 2017 | $3,252 | $93,802 | $8,400 | $85,402 |
| 2016 | $3,003 | $93,802 | $8,400 | $85,402 |
| 2015 | $4,211 | $93,132 | $8,400 | $84,732 |
| 2014 | $1,438 | $95,232 | $10,500 | $84,732 |
Source: Public Records
Map
Nearby Homes
- 117 Legare Ct
- 4971 Ayers Rd
- 1153 Saint Andrews Dr
- 740 Ivy Brook Way
- 715 Ivy Brook Way
- 776 Ivy Brook Way
- 1183 Saint Andrews Dr
- 785 Ivy Brook Way
- 631 Ivy Brook Way
- 621 Ivy Brook Way
- 2006 Fall Harvest Dr Unit LOT 278
- 2002 Fall Harvest Dr Unit LOT 280
- 2006 Fall Harvest Dr
- 2002 Fall Harvest Dr
- 2008 Fall Harvest Dr Unit LOT 277
- 2004 Fall Harvest Dr Unit LOT 279
- 116 Legare Ct
- 108 Legare Ct Unit 9
- 108 Legare Ct
- 113 Legare Ct
- 118 Troon Way
- 105 Legare Ct
- 105 Legare Ct Unit 2
- 104 Legare Ct Unit 10
- 104 Legare Ct
- 0 Legare Ct Unit 7308619
- 0 Legare Ct Unit 8215934
- 0 Legare Ct Unit 7614830
- 0 Legare Ct Unit 7308908
- 0 Legare Ct Unit 3124910
- 0 Legare Ct
- 101 Legare Ct
- 100 Legare Ct Unit 11
- 116 Troon Way
- 4850 Ayers Rd
- 150 Gleneagles Ct