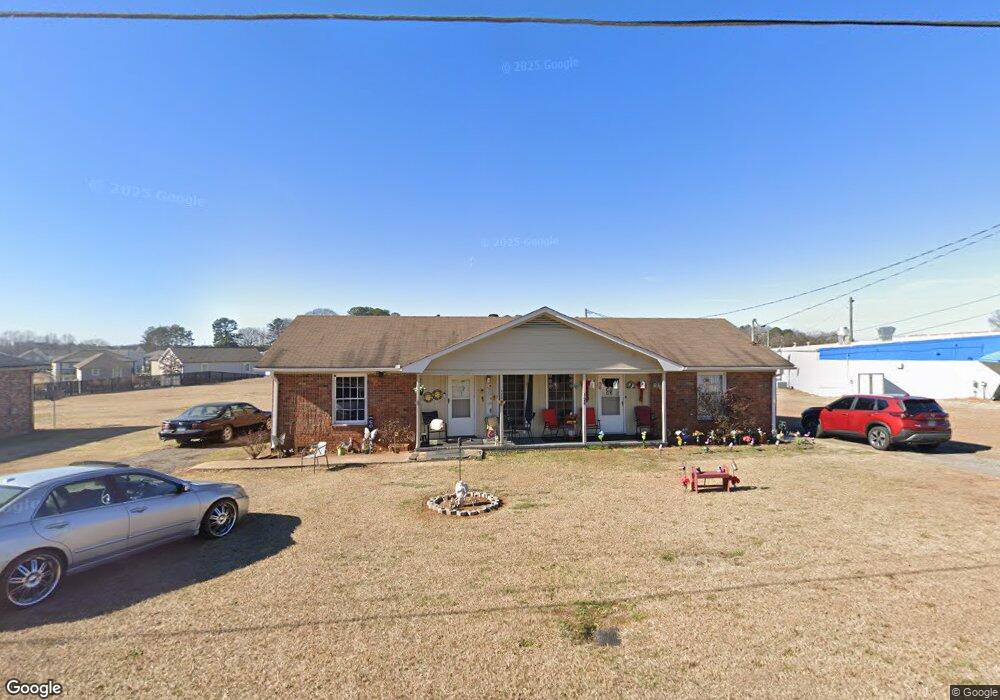
120 Lexington Heights Athens, GA 30605
Estimated Value: $147,785 - $311,000
--
Bed
2
Baths
1,539
Sq Ft
$140/Sq Ft
Est. Value
About This Home
This home is located at 120 Lexington Heights, Athens, GA 30605 and is currently estimated at $216,196, approximately $140 per square foot. 120 Lexington Heights is a home located in Clarke County with nearby schools including Gaines Elementary School, Hilsman Middle School, and Cedar Shoals High School.
Ownership History
Date
Name
Owned For
Owner Type
Purchase Details
Closed on
Feb 3, 2020
Sold by
Payne Jean
Bought by
Bugg Chance Campbell
Current Estimated Value
Home Financials for this Owner
Home Financials are based on the most recent Mortgage that was taken out on this home.
Original Mortgage
$68,000
Interest Rate
3.7%
Mortgage Type
New Conventional
Purchase Details
Closed on
Oct 23, 2013
Sold by
Payne Martha Jean Jenkins
Bought by
Payne Martha Jean Jenkins
Purchase Details
Closed on
May 4, 2010
Sold by
Cox Julian H and Cox Mary S
Bought by
Payne Jean and Payne Dorsey
Purchase Details
Closed on
Dec 16, 1998
Sold by
Joe Daniel Smith Revocable Trust By
Bought by
Cox Julian H and Cox Mary S
Purchase Details
Closed on
Dec 2, 1997
Sold by
Cox Julian H and Cox Mary S
Bought by
Joe Daniel Smith Revocable Trust By
Purchase Details
Closed on
Nov 6, 1989
Sold by
Kimbrough Wh
Bought by
Cox Julian H and Cox Mary S
Create a Home Valuation Report for This Property
The Home Valuation Report is an in-depth analysis detailing your home's value as well as a comparison with similar homes in the area
Home Values in the Area
Average Home Value in this Area
Purchase History
| Date | Buyer | Sale Price | Title Company |
|---|---|---|---|
| Bugg Chance Campbell | $85,000 | -- | |
| Payne Martha Jean Jenkins | -- | -- | |
| Payne Jean | $67,200 | -- | |
| Cox Julian H | -- | -- | |
| Joe Daniel Smith Revocable Trust By | -- | -- | |
| Cox Julian H | -- | -- |
Source: Public Records
Mortgage History
| Date | Status | Borrower | Loan Amount |
|---|---|---|---|
| Closed | Bugg Chance Campbell | $68,000 |
Source: Public Records
Tax History Compared to Growth
Tax History
| Year | Tax Paid | Tax Assessment Tax Assessment Total Assessment is a certain percentage of the fair market value that is determined by local assessors to be the total taxable value of land and additions on the property. | Land | Improvement |
|---|---|---|---|---|
| 2024 | $2,463 | $70,514 | $12,000 | $58,514 |
| 2023 | $2,204 | $64,033 | $10,400 | $53,633 |
| 2022 | $1,649 | $51,705 | $10,400 | $41,305 |
| 2021 | $1,146 | $37,163 | $8,000 | $29,163 |
| 2020 | $1,130 | $33,518 | $8,000 | $25,518 |
| 2019 | $1,161 | $34,204 | $8,000 | $26,204 |
| 2018 | $817 | $24,061 | $8,000 | $16,061 |
| 2017 | $755 | $22,248 | $8,000 | $14,248 |
| 2016 | $756 | $22,264 | $8,000 | $14,264 |
| 2015 | $773 | $22,740 | $8,000 | $14,740 |
| 2014 | $779 | $22,877 | $8,000 | $14,877 |
Source: Public Records
Map
Nearby Homes
- 1995 Lexington Rd
- 1934 Lexington Rd
- 2451 Oakley Trail
- 2025 Oakley Trail
- 355 Barnett Shoals Rd
- 335 Barnett Shoals Rd
- 660 Barnett Shoals Rd Unit 213
- 260 Parkridge Dr
- 1035 Barnett Shoals Rd Unit 1240
- 490 Barnett Shoals Rd Unit 820
- 490 Barnett Shoals Rd Unit 130
- 490 Barnett Shoals Rd Unit 406
- 490 Barnett Shoals Rd Unit 919
- 490 Barnett Shoals Rd Unit 819
- 490 Barnett Shoals Rd Unit 134
- 490 Barnett Shoals Rd Unit 536
- 130 Lexington Heights
- 140 Lexington Heights
- 2150 Lexington Rd
- 4 Lexington Heights
- 2 Lexington Heights
- 3 Lexington Heights
- 6 Lexington Heights
- 5 Lexington Heights
- 150 Lexington Heights Unit 150-400
- 150 Lexington Heights
- 150-`152 Lexington Heights Dr
- 1946 Lexington Rd
- 1975 Lexington Rd
- 1985 Lexington Rd
- 1940 Lexington Rd
- 160 Lexington Heights
- 1965 Lexington Rd
- 2515 Lexington Rd
- 1945 Lexington Rd
- 170 Lexington Heights