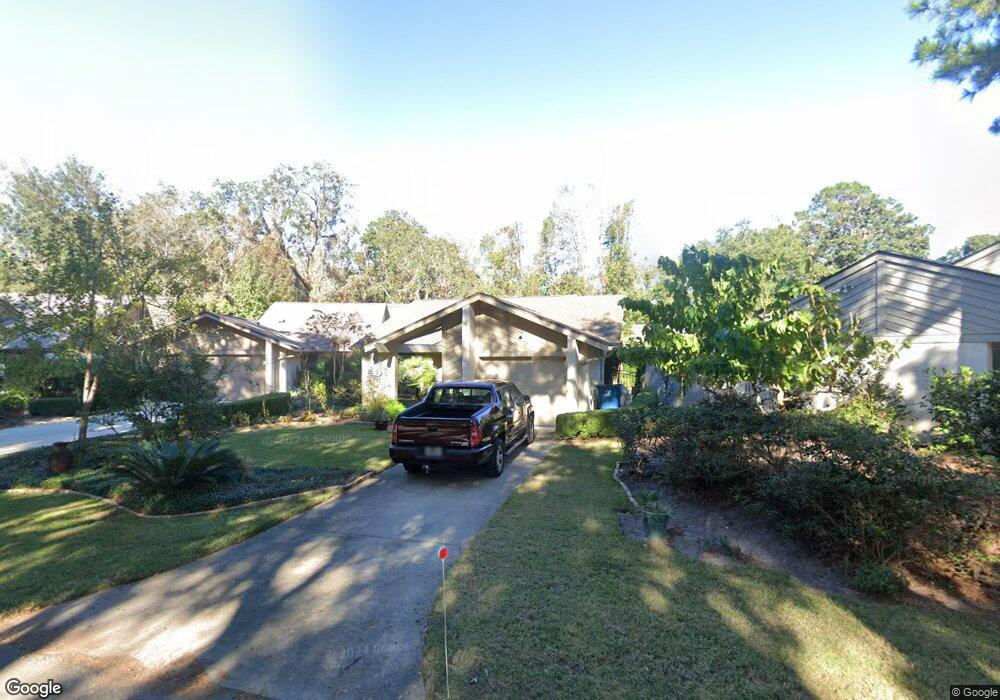
120 Linkside Dr Saint Simons Island, GA 31522
Estimated Value: $395,285 - $581,000
2
Beds
2
Baths
1,131
Sq Ft
$427/Sq Ft
Est. Value
About This Home
This home is located at 120 Linkside Dr, Saint Simons Island, GA 31522 and is currently estimated at $482,571, approximately $426 per square foot. 120 Linkside Dr is a home located in Glynn County with nearby schools including Oglethorpe Point Elementary School, Glynn Middle School, and Glynn Academy.
Ownership History
Date
Name
Owned For
Owner Type
Purchase Details
Closed on
Jun 26, 2024
Sold by
Delaney William P
Bought by
Deaney William Paul Tr and William Paul Delaney
Current Estimated Value
Purchase Details
Closed on
Aug 27, 2007
Sold by
Delaney William P
Bought by
Delaney William P and Smith Charla
Purchase Details
Closed on
Nov 17, 2006
Sold by
Wood Linda J
Bought by
Delaney William P
Home Financials for this Owner
Home Financials are based on the most recent Mortgage that was taken out on this home.
Original Mortgage
$148,000
Interest Rate
6.41%
Mortgage Type
New Conventional
Purchase Details
Closed on
May 5, 2005
Sold by
Escoe James E
Bought by
Wood Linda J and Wicker Judy S
Home Financials for this Owner
Home Financials are based on the most recent Mortgage that was taken out on this home.
Original Mortgage
$222,300
Interest Rate
5.88%
Mortgage Type
New Conventional
Create a Home Valuation Report for This Property
The Home Valuation Report is an in-depth analysis detailing your home's value as well as a comparison with similar homes in the area
Home Values in the Area
Average Home Value in this Area
Purchase History
| Date | Buyer | Sale Price | Title Company |
|---|---|---|---|
| Deaney William Paul Tr | -- | -- | |
| Delaney William P | -- | -- | |
| Delaney William P | $335,000 | -- | |
| Wood Linda J | $250,000 | -- |
Source: Public Records
Mortgage History
| Date | Status | Borrower | Loan Amount |
|---|---|---|---|
| Previous Owner | Delaney William P | $148,000 | |
| Previous Owner | Wood Linda J | $222,300 |
Source: Public Records
Tax History Compared to Growth
Tax History
| Year | Tax Paid | Tax Assessment Tax Assessment Total Assessment is a certain percentage of the fair market value that is determined by local assessors to be the total taxable value of land and additions on the property. | Land | Improvement |
|---|---|---|---|---|
| 2025 | $3,084 | $122,960 | $32,000 | $90,960 |
| 2024 | $3,152 | $125,680 | $32,000 | $93,680 |
| 2023 | $677 | $125,680 | $32,000 | $93,680 |
| 2022 | $801 | $117,000 | $32,000 | $85,000 |
| 2021 | $821 | $115,480 | $32,000 | $83,480 |
| 2020 | $839 | $115,480 | $32,000 | $83,480 |
| 2019 | $823 | $101,840 | $20,000 | $81,840 |
| 2018 | $897 | $95,560 | $20,000 | $75,560 |
| 2017 | $872 | $93,040 | $20,000 | $73,040 |
| 2016 | $714 | $93,040 | $20,000 | $73,040 |
| 2015 | $634 | $93,040 | $20,000 | $73,040 |
| 2014 | $634 | $82,960 | $20,000 | $62,960 |
Source: Public Records
Map
Nearby Homes
- 668 N Golf Villa Rd
- 662 N Golf Villa Rd
- 652 N Golf Villas
- 1086 Sinclair Pointe
- 416 Fairway Villas
- 19 Sinclair Way
- 108 N Windward Dr
- 491 Cedar Walk
- 413 Fairway Villas
- 300 S Harrington Rd
- 147 Fifty Oaks Ln
- 18 Country Club Ct
- 131 Harrogate Rd
- 193 Fifty Oaks Ln
- 525 Conservation Dr
- 257 Villager Dr
- 259 Moss Oak Ln
- 257 Moss Oak Ln
- 106 Draughons Dr
- 203 Highpoint St
- 119 Linkside Dr
- 121 Linkside Dr
- 118 Linkside Dr
- 123 Linkside Dr
- 124 Linkside Dr
- 122 Linkside Dr
- 117 Linkside Dr
- 125 Linkside Dr Unit 125
- 116 Linkside Dr
- 105 Linkside Dr
- 106 Linkside Dr
- 104 Linkside Dr
- 125 Linkside Dr
- 103 Linkside Dr
- 108 Linkside Dr
- 136 Mamalou Ln
- 102 Linkside Dr
- 102 Linkside Dr * Golf
- 115 Linkside Dr
- 664 N Golf Villas