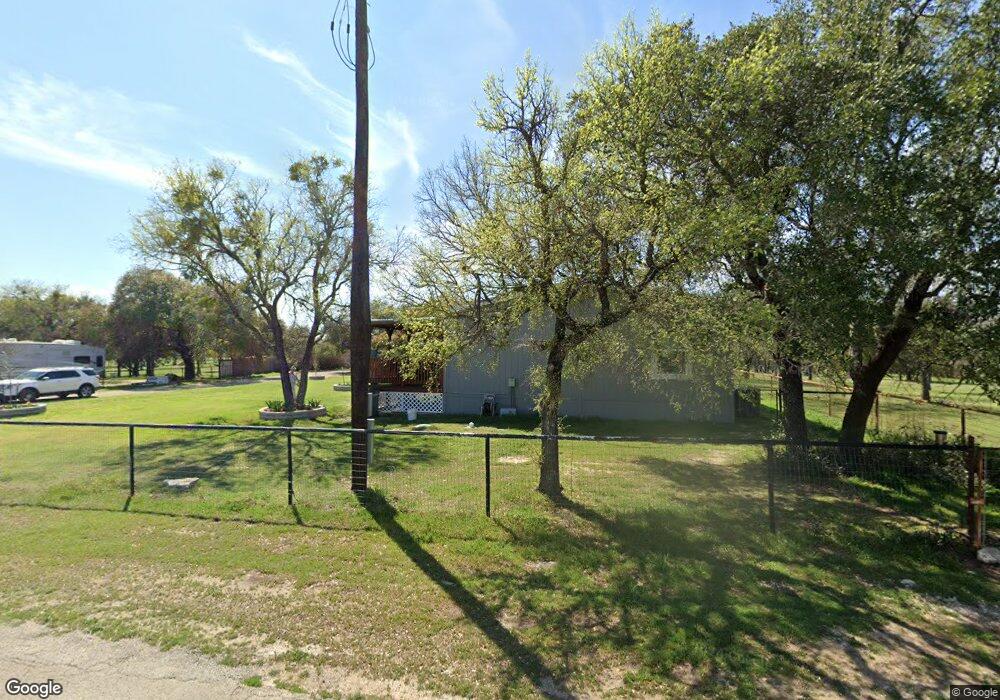
120 Livingston Ct Weatherford, TX 76087
Estimated Value: $375,561 - $381,000
3
Beds
2
Baths
1,952
Sq Ft
$194/Sq Ft
Est. Value
About This Home
This home is located at 120 Livingston Ct, Weatherford, TX 76087 and is currently estimated at $378,281, approximately $193 per square foot. 120 Livingston Ct is a home located in Parker County with nearby schools including Curtis Elementary School, Hall Middle School, and Weatherford High School.
Ownership History
Date
Name
Owned For
Owner Type
Purchase Details
Closed on
Nov 27, 2019
Sold by
Regalado Robert and Regalado Barbara
Bought by
Regalado Robert C and Regalado Barbara J
Current Estimated Value
Purchase Details
Closed on
Apr 16, 2019
Sold by
Kirkman Carla S
Bought by
Regalado Robert and Regalado Barbara
Home Financials for this Owner
Home Financials are based on the most recent Mortgage that was taken out on this home.
Original Mortgage
$250,000
Outstanding Balance
$220,237
Interest Rate
4.4%
Mortgage Type
VA
Estimated Equity
$158,044
Purchase Details
Closed on
Jul 10, 2004
Sold by
Patton Jerrell and Patton Suzanne
Bought by
Kirkman Carla S
Purchase Details
Closed on
Jul 1, 2004
Sold by
Livingston Billy E and Livingston Gail D
Bought by
Kirkman Carla S
Create a Home Valuation Report for This Property
The Home Valuation Report is an in-depth analysis detailing your home's value as well as a comparison with similar homes in the area
Home Values in the Area
Average Home Value in this Area
Purchase History
| Date | Buyer | Sale Price | Title Company |
|---|---|---|---|
| Regalado Robert C | -- | None Available | |
| Regalado Robert | -- | Lawyers Title | |
| Kirkman Carla S | -- | -- | |
| Kirkman Carla S | -- | -- |
Source: Public Records
Mortgage History
| Date | Status | Borrower | Loan Amount |
|---|---|---|---|
| Open | Regalado Robert | $250,000 |
Source: Public Records
Tax History Compared to Growth
Tax History
| Year | Tax Paid | Tax Assessment Tax Assessment Total Assessment is a certain percentage of the fair market value that is determined by local assessors to be the total taxable value of land and additions on the property. | Land | Improvement |
|---|---|---|---|---|
| 2025 | -- | $419,110 | $93,850 | $325,260 |
| 2024 | -- | $369,340 | $86,560 | $282,780 |
| 2023 | $4,998 | $310,070 | $0 | $0 |
| 2022 | $5,242 | $281,890 | $61,130 | $220,760 |
| 2021 | $5,179 | $281,890 | $61,130 | $220,760 |
| 2020 | $4,731 | $233,810 | $47,520 | $186,290 |
| 2019 | $4,410 | $233,810 | $47,520 | $186,290 |
| 2018 | $4,045 | $188,860 | $35,750 | $153,110 |
| 2017 | $3,752 | $188,860 | $35,750 | $153,110 |
| 2016 | $3,411 | $159,790 | $25,340 | $134,450 |
| 2015 | $1,144 | $159,790 | $25,340 | $134,450 |
| 2014 | $1,281 | $127,000 | $25,340 | $101,660 |
Source: Public Records
Map
Nearby Homes
- 4783 Brazos Cir
- 428 Mesquite Trail
- 4725 Valley View Cir
- 4932 Cimmaron Trail
- 4948 Cimmaron Trail
- 4709 Chisholm Trail
- TBD 11 Gremminger Ct
- 329 Longhorn Trail
- 246 Comanche Trail
- 190 Mesquite Trail
- 340 Western Lake Dr
- 112 Pioneer Trail
- 1009 Timber Hills Dr
- 101 Bronco Ln
- 1074 Timber Hills Dr
- TBD I-20 Service Rd
- TBD Fm 1189
- 4549 Arrowhead Dr
- 2008 Walter Joseph Way
- TBD Western Lake Dr
- 124 Livingston Ct
- 123 Livingston Ct
- 112 Livingston Ct
- 115 Livingston Ct
- 107 Livingston Ct
- 200 Livingston Rd
- 300 Livingston Rd
- 103 Livingston Ct
- 4810 Cimmaron Trail
- 4816 Cimmaron Trail
- 6001 Bethel Rd
- 115 Livingston Rd
- 112 Livingston Rd
- 4800 Cimmaron Trail
- 4756 Cimmaron Trail
- 4836 Cimmaron Trail
- 104 Livingston Rd
- 217 Livingston Rd
- 4774 Brazos Cir
- 4779 Brazos Cir