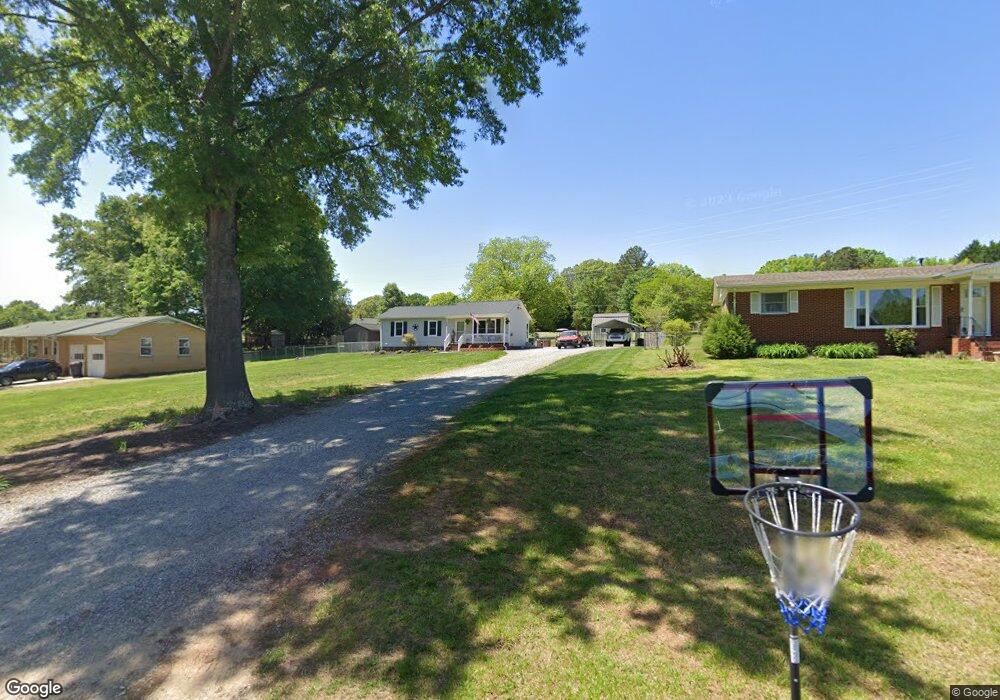
120 Longbow Rd Reidsville, NC 27320
Estimated Value: $219,009 - $239,000
3
Beds
2
Baths
1,008
Sq Ft
$230/Sq Ft
Est. Value
About This Home
This home is located at 120 Longbow Rd, Reidsville, NC 27320 and is currently estimated at $231,752, approximately $229 per square foot. 120 Longbow Rd is a home located in Rockingham County with nearby schools including Reidsville High School, Monroeton Elementary School, and Reidsville Middle School.
Ownership History
Date
Name
Owned For
Owner Type
Purchase Details
Closed on
Jun 6, 2022
Sold by
Maria Palmer
Bought by
Hancock Joshua Keith
Current Estimated Value
Home Financials for this Owner
Home Financials are based on the most recent Mortgage that was taken out on this home.
Original Mortgage
$152,000
Outstanding Balance
$144,400
Interest Rate
5.09%
Mortgage Type
New Conventional
Estimated Equity
$87,352
Purchase Details
Closed on
May 15, 2018
Sold by
Winingham Christa Custer
Bought by
Hancock Joshuia and Palmer Maria
Home Financials for this Owner
Home Financials are based on the most recent Mortgage that was taken out on this home.
Original Mortgage
$125,500
Interest Rate
4.87%
Mortgage Type
Adjustable Rate Mortgage/ARM
Purchase Details
Closed on
Sep 24, 2013
Sold by
Steed Susan F and Steed Kevin L
Bought by
Winingham Christa C
Create a Home Valuation Report for This Property
The Home Valuation Report is an in-depth analysis detailing your home's value as well as a comparison with similar homes in the area
Home Values in the Area
Average Home Value in this Area
Purchase History
| Date | Buyer | Sale Price | Title Company |
|---|---|---|---|
| Hancock Joshua Keith | -- | Seth M Woodall & Associates Pl | |
| Hancock Joshuia | $123,500 | None Available | |
| Winingham Christa C | $66,528 | None Available |
Source: Public Records
Mortgage History
| Date | Status | Borrower | Loan Amount |
|---|---|---|---|
| Open | Hancock Joshua Keith | $152,000 | |
| Previous Owner | Hancock Joshuia | $125,500 |
Source: Public Records
Tax History Compared to Growth
Tax History
| Year | Tax Paid | Tax Assessment Tax Assessment Total Assessment is a certain percentage of the fair market value that is determined by local assessors to be the total taxable value of land and additions on the property. | Land | Improvement |
|---|---|---|---|---|
| 2025 | $2,203 | $175,555 | $14,224 | $161,331 |
| 2024 | $2,177 | $175,555 | $14,224 | $161,331 |
| 2023 | $2,177 | $113,658 | $12,880 | $100,778 |
| 2022 | $1,630 | $113,658 | $12,880 | $100,778 |
| 2021 | $1,630 | $113,658 | $12,880 | $100,778 |
| 2020 | $1,630 | $113,658 | $12,880 | $100,778 |
| 2019 | $1,630 | $113,658 | $12,880 | $100,778 |
| 2018 | $1,266 | $88,173 | $16,320 | $71,853 |
| 2017 | $1,266 | $88,173 | $16,320 | $71,853 |
| 2015 | $1,279 | $88,173 | $16,320 | $71,853 |
| 2014 | $1,259 | $87,697 | $16,320 | $71,377 |
Source: Public Records
Map
Nearby Homes
- 107 Sunny Place Unit 4B
- 170 Link Rd
- 516 Birchwood Dr
- 2702 Ashcroft Dr
- 00 Ashcroft Dr
- 281 Cross Key Rd
- 2310 Belmont Dr
- 160 Vaden Rd
- 115 Washburn Lake Rd
- 8906 U S 158
- 263 Lake Meadows Dr
- 00 N Carolina 87
- 2203 Belmont Dr
- 2402 Pine Ln
- 203 W Stonebury Ct
- 1027 Cypress Dr
- 119 Hillcrest Rd
- 2329 Westover Dr
- 2025 Belmont Dr
- 000 Lot 2 Cypress Dr