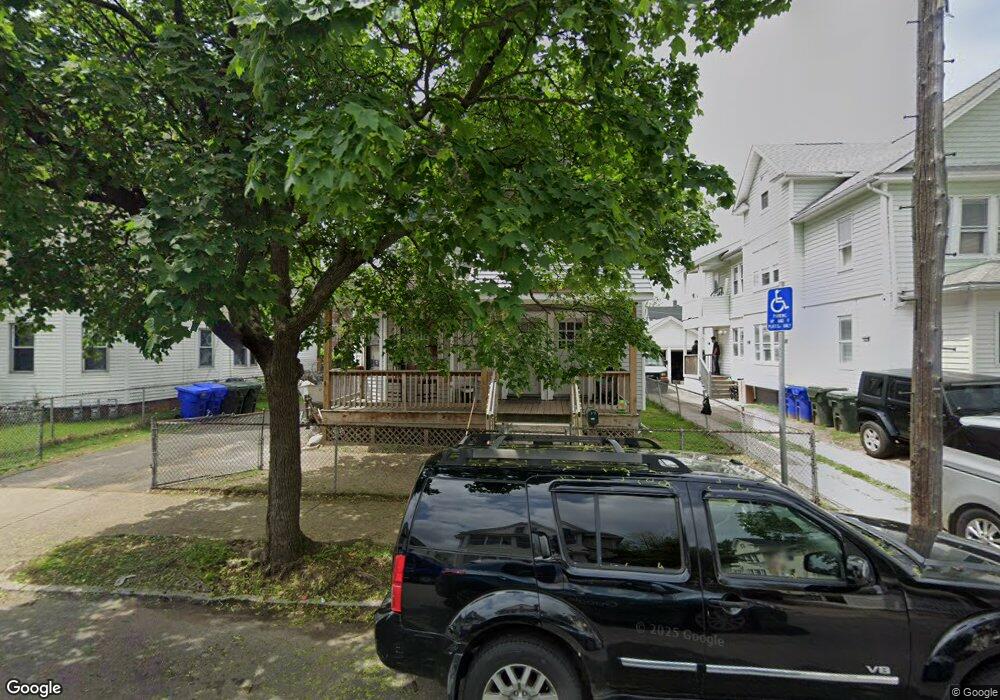
120 Malden St Unit 122 Springfield, MA 01108
Forest Park NeighborhoodEstimated Value: $303,000 - $393,000
8
Beds
2
Baths
2,891
Sq Ft
$117/Sq Ft
Est. Value
About This Home
This home is located at 120 Malden St Unit 122, Springfield, MA 01108 and is currently estimated at $338,283, approximately $117 per square foot. 120 Malden St Unit 122 is a home located in Hampden County with nearby schools including Kensington International School, Forest Park Middle School, and High School Of Commerce.
Ownership History
Date
Name
Owned For
Owner Type
Purchase Details
Closed on
Sep 16, 2021
Sold by
Val Muller and Andrade-Val Madalena F
Bought by
Val Muller
Current Estimated Value
Purchase Details
Closed on
Dec 12, 2006
Sold by
Harmel Joseph
Bought by
Wells Fargo Bk Na
Purchase Details
Closed on
Nov 1, 2004
Sold by
Bailey Hugh D
Bought by
Joseph Harmel and Lucas Mircaisse
Home Financials for this Owner
Home Financials are based on the most recent Mortgage that was taken out on this home.
Original Mortgage
$135,000
Interest Rate
5.74%
Mortgage Type
Purchase Money Mortgage
Purchase Details
Closed on
May 26, 1993
Sold by
Arslanian Oscar and Arslanian Margaret
Bought by
Bailey Hugh D
Home Financials for this Owner
Home Financials are based on the most recent Mortgage that was taken out on this home.
Original Mortgage
$82,175
Interest Rate
7.41%
Mortgage Type
Purchase Money Mortgage
Create a Home Valuation Report for This Property
The Home Valuation Report is an in-depth analysis detailing your home's value as well as a comparison with similar homes in the area
Home Values in the Area
Average Home Value in this Area
Purchase History
| Date | Buyer | Sale Price | Title Company |
|---|---|---|---|
| Val Muller | -- | None Available | |
| Wells Fargo Bk Na | $136,000 | -- | |
| Joseph Harmel | $150,000 | -- | |
| Bailey Hugh D | $86,500 | -- |
Source: Public Records
Mortgage History
| Date | Status | Borrower | Loan Amount |
|---|---|---|---|
| Previous Owner | Joseph Harmel | $135,000 | |
| Previous Owner | Joseph Harmel | $7,500 | |
| Previous Owner | Bailey Hugh D | $82,175 | |
| Closed | Bailey Hugh D | $2,415 |
Source: Public Records
Tax History Compared to Growth
Tax History
| Year | Tax Paid | Tax Assessment Tax Assessment Total Assessment is a certain percentage of the fair market value that is determined by local assessors to be the total taxable value of land and additions on the property. | Land | Improvement |
|---|---|---|---|---|
| 2025 | $4,326 | $275,900 | $30,000 | $245,900 |
| 2024 | $4,062 | $252,900 | $30,000 | $222,900 |
| 2023 | $3,720 | $218,200 | $27,300 | $190,900 |
| 2022 | $3,147 | $167,200 | $25,500 | $141,700 |
| 2021 | $2,933 | $155,200 | $23,200 | $132,000 |
| 2020 | $2,806 | $143,700 | $23,200 | $120,500 |
| 2019 | $2,944 | $149,600 | $23,200 | $126,400 |
| 2018 | $2,739 | $139,200 | $23,200 | $116,000 |
| 2017 | $2,629 | $133,700 | $21,800 | $111,900 |
| 2016 | $2,243 | $114,100 | $21,800 | $92,300 |
| 2015 | $2,270 | $115,400 | $21,800 | $93,600 |
Source: Public Records
Map
Nearby Homes
- 106 Malden St
- 298 Oakland St
- 320 Oakland St
- 242-244 Orange St
- 78-80 Shamrock St
- 55 Malden St
- 371-373 Oakland St
- 39-41 Malden St
- 292-294 Orange St
- 29 Wareham St
- 25 Malden St
- 15 Malden St
- 327 Orange St
- 8 Wilmont St
- 127 Dickinson St
- 52 Wilmont St
- 140-142 Dickinson St
- 192 White St
- 0 Allen St (Ss)
- 3 Noel St
- 116 Malden St Unit 118
- 130 Malden St Unit 132
- 110 Malden St Unit 112
- 110-112 Malden St
- 112 Malden St Unit 1
- 291 Oakland St
- 291 Oakland St
- 134 Malden St Unit 136
- 134-136 Malden St
- 119 Malden St Unit 121
- 125 Malden St
- 115-117 Malden St
- 115 Malden St Unit 117
- 311 Oakland St
- 129 Malden St Unit 131
- 129-131 Malden St
- 109 Malden St Unit 111
- 100 Malden St Unit 102
- 315 Oakland St
- 283 Oakland St