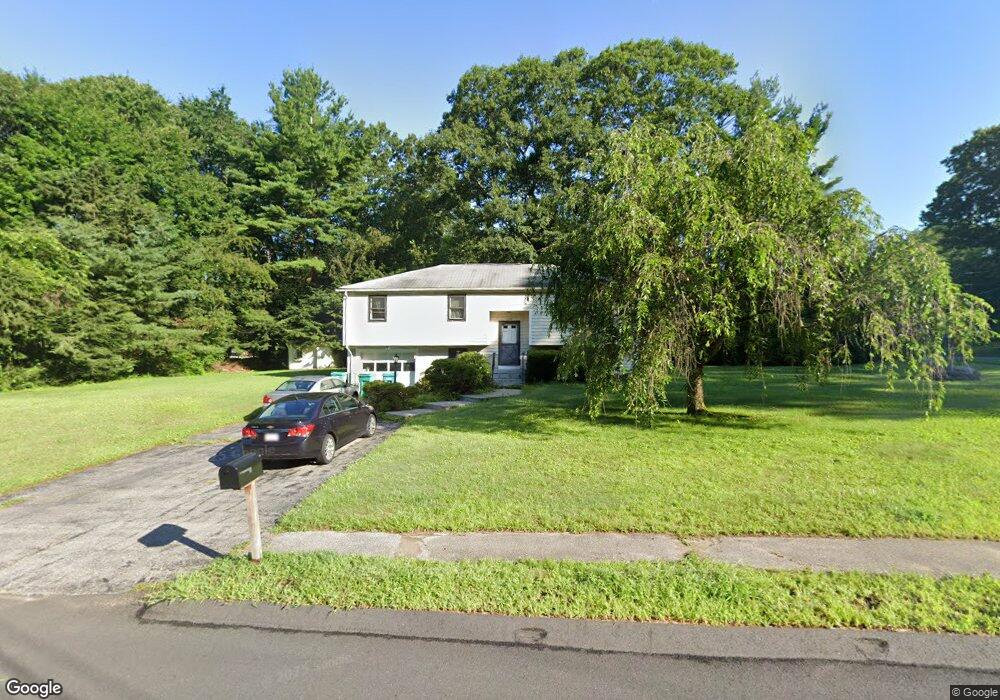
120 Mason Rd Whitinsville, MA 01588
Estimated Value: $455,935 - $470,000
3
Beds
2
Baths
1,158
Sq Ft
$400/Sq Ft
Est. Value
About This Home
This home is located at 120 Mason Rd, Whitinsville, MA 01588 and is currently estimated at $462,734, approximately $399 per square foot. 120 Mason Rd is a home located in Worcester County with nearby schools including Northbridge Elementary School, Northbridge Middle School, and Northbridge High School.
Ownership History
Date
Name
Owned For
Owner Type
Purchase Details
Closed on
May 9, 2006
Sold by
Chmielewski Stanley
Bought by
Pileggi Alison and Pileggi David J
Current Estimated Value
Home Financials for this Owner
Home Financials are based on the most recent Mortgage that was taken out on this home.
Original Mortgage
$223,900
Outstanding Balance
$127,806
Interest Rate
6.34%
Mortgage Type
Purchase Money Mortgage
Estimated Equity
$334,928
Create a Home Valuation Report for This Property
The Home Valuation Report is an in-depth analysis detailing your home's value as well as a comparison with similar homes in the area
Home Values in the Area
Average Home Value in this Area
Purchase History
| Date | Buyer | Sale Price | Title Company |
|---|---|---|---|
| Pileggi Alison | $276,900 | -- | |
| Pileggi Alison | $276,900 | -- |
Source: Public Records
Mortgage History
| Date | Status | Borrower | Loan Amount |
|---|---|---|---|
| Open | Pileggi Alison | $223,900 | |
| Closed | Pileggi Alison | $223,900 |
Source: Public Records
Tax History Compared to Growth
Tax History
| Year | Tax Paid | Tax Assessment Tax Assessment Total Assessment is a certain percentage of the fair market value that is determined by local assessors to be the total taxable value of land and additions on the property. | Land | Improvement |
|---|---|---|---|---|
| 2025 | $4,363 | $370,100 | $142,000 | $228,100 |
| 2024 | $4,239 | $350,600 | $142,000 | $208,600 |
| 2023 | $4,397 | $339,300 | $142,000 | $197,300 |
| 2022 | $4,062 | $295,000 | $109,200 | $185,800 |
| 2021 | $3,895 | $268,800 | $104,000 | $164,800 |
| 2020 | $3,625 | $261,900 | $104,000 | $157,900 |
| 2019 | $3,285 | $253,300 | $104,000 | $149,300 |
| 2018 | $3,125 | $241,500 | $99,000 | $142,500 |
| 2017 | $3,127 | $231,100 | $99,000 | $132,100 |
| 2016 | $2,911 | $211,700 | $90,000 | $121,700 |
| 2015 | $2,833 | $211,700 | $90,000 | $121,700 |
| 2014 | $2,807 | $211,700 | $90,000 | $121,700 |
Source: Public Records
Map
Nearby Homes
- 17 Overlook St
- 24 Crescent St Unit 6
- 2 D St
- 14 C St Unit 24
- 14 C St Unit 14
- 11 A St Unit 11
- 46 Rebecca Rd
- 192 Rebecca Rd
- 86 Kingsnorth St
- 731 Samuel Dr
- 111 Windsor Ridge Dr
- Lots 1-9 Spring St
- 708 Marston Rd
- 56 Prescott Rd
- 201 Prescott Rd
- 9 Banning Dr
- 135 Windstone Dr
- 1076 Hill St
- 18 East St Unit 24
- 128 Linwood Ave