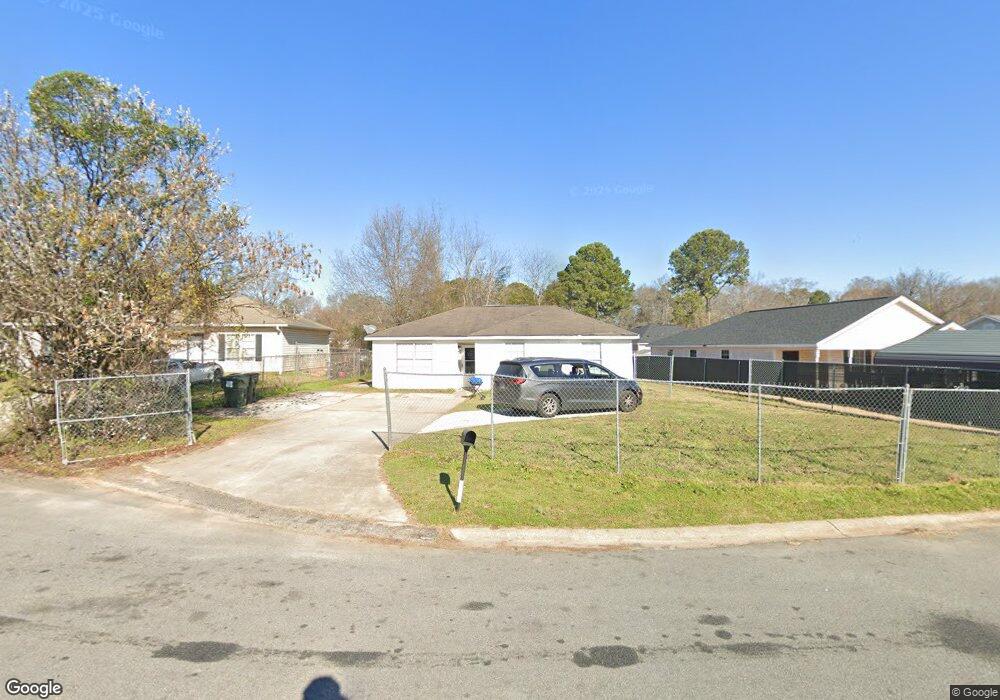
120 Mauldon Ct Warner Robins, GA 31093
Estimated Value: $124,363 - $157,000
3
Beds
2
Baths
1,018
Sq Ft
$135/Sq Ft
Est. Value
About This Home
This home is located at 120 Mauldon Ct, Warner Robins, GA 31093 and is currently estimated at $137,591, approximately $135 per square foot. 120 Mauldon Ct is a home located in Houston County with nearby schools including Parkwood Elementary School, Northside Middle School, and Northside High School.
Ownership History
Date
Name
Owned For
Owner Type
Purchase Details
Closed on
Mar 18, 2008
Sold by
Lasalle Bank Na
Bought by
Viray Mienardo G and Viray Roselily B
Current Estimated Value
Purchase Details
Closed on
Nov 6, 2007
Sold by
Crawford Vincent L
Bought by
Lasalle Bank Na and Structured Asset Securities Corp Structu
Purchase Details
Closed on
Oct 30, 2007
Sold by
Citifinancial
Bought by
Crawford Vincent L
Purchase Details
Closed on
Jul 7, 1992
Sold by
Ballard Raymond O
Bought by
Crawford Vincent L
Purchase Details
Closed on
Apr 15, 1992
Sold by
Great American Builders Inc
Bought by
Ballard Raymond O
Create a Home Valuation Report for This Property
The Home Valuation Report is an in-depth analysis detailing your home's value as well as a comparison with similar homes in the area
Home Values in the Area
Average Home Value in this Area
Purchase History
| Date | Buyer | Sale Price | Title Company |
|---|---|---|---|
| Viray Mienardo G | $57,000 | None Available | |
| Lasalle Bank Na | $61,200 | None Available | |
| Crawford Vincent L | -- | None Available | |
| Crawford Vincent L | $40,700 | -- | |
| Ballard Raymond O | $7,100 | -- |
Source: Public Records
Tax History
| Year | Tax Paid | Tax Assessment Tax Assessment Total Assessment is a certain percentage of the fair market value that is determined by local assessors to be the total taxable value of land and additions on the property. | Land | Improvement |
|---|---|---|---|---|
| 2025 | $1,260 | $43,280 | $6,000 | $37,280 |
| 2024 | $1,272 | $38,880 | $6,000 | $32,880 |
| 2023 | $969 | $29,400 | $6,000 | $23,400 |
| 2022 | $487 | $21,200 | $4,200 | $17,000 |
| 2021 | $443 | $19,160 | $4,200 | $14,960 |
| 2020 | $435 | $18,720 | $4,200 | $14,520 |
| 2019 | $435 | $18,720 | $4,200 | $14,520 |
| 2018 | $435 | $18,720 | $4,200 | $14,520 |
| 2017 | $435 | $18,720 | $4,200 | $14,520 |
| 2016 | $436 | $18,720 | $4,200 | $14,520 |
| 2015 | -- | $18,720 | $4,200 | $14,520 |
| 2014 | -- | $18,720 | $4,200 | $14,520 |
| 2013 | -- | $18,720 | $4,200 | $14,520 |
Source: Public Records
Map
Nearby Homes
- 437 Dunmurry Place
- 405 Dunmurry Place
- 212 Dunmurry Place
- 100 Mauldon Ct
- 302 Dunmurry Place
- 302 Hawaii Ave
- 102 Oregon Ct
- 111 Wisconsin Ave
- 239 Ward St
- 249 Ward St
- 145 Northsky Dr
- 300 Ward St
- 220 Francis St
- 422 Carolina Ave
- 427 Alabama Ave
- 111 Briarwood Dr
- 108 Smith Place
- 213 Oklahoma Ave
- 500 Northside Dr
- 714 Camellia Cir
- 118 Mauldon Ct
- 122 Mauldon Ct
- 116 Mauldon Ct
- 423 Dunmurry Place
- 421 Dunmurry Place
- 425 Dunmurry Place
- 124 Mauldon Ct
- 419 Dunmurry Place
- 114 Mauldon Ct
- 117 Mauldon Ct
- 427 Dunmurry Place
- 119 Mauldon Ct
- 126 Mauldon Ct
- 115 Mauldon Ct
- 417 Dunmurry Place
- 417 Dunmurry Place Unit 50
- 121 Mauldon Ct
- 112 Mauldon Ct
- 429 Dunmurry Place
- 113 Mauldon Ct
Your Personal Tour Guide
Ask me questions while you tour the home.