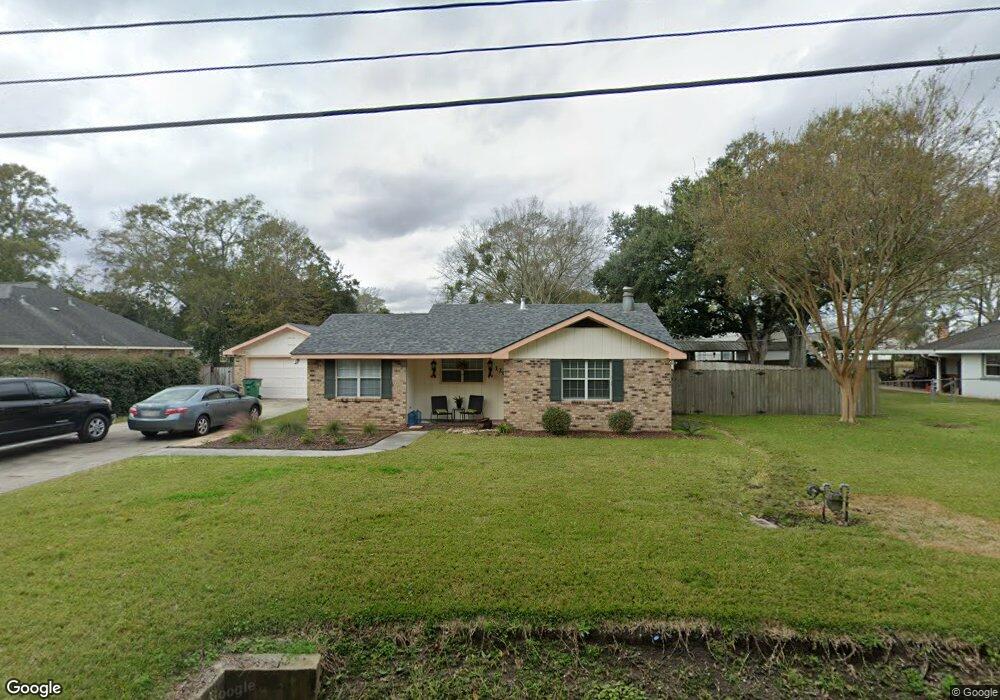
120 Mimosa Ave Luling, LA 70070
Estimated Value: $245,681 - $277,000
3
Beds
3
Baths
1,794
Sq Ft
$147/Sq Ft
Est. Value
About This Home
This home is located at 120 Mimosa Ave, Luling, LA 70070 and is currently estimated at $262,920, approximately $146 per square foot. 120 Mimosa Ave is a home located in St. Charles Parish with nearby schools including Mimosa Park Elementary School, Lakewood Elementary School, and J.B. Martin Middle School.
Ownership History
Date
Name
Owned For
Owner Type
Purchase Details
Closed on
Apr 15, 2011
Sold by
Waterman Danny O and Waterman Jessica Jacobs
Bought by
Cella Shaun Michael and Cella Samantha Lynne
Current Estimated Value
Home Financials for this Owner
Home Financials are based on the most recent Mortgage that was taken out on this home.
Original Mortgage
$179,335
Outstanding Balance
$122,047
Interest Rate
4.82%
Mortgage Type
FHA
Estimated Equity
$140,873
Create a Home Valuation Report for This Property
The Home Valuation Report is an in-depth analysis detailing your home's value as well as a comparison with similar homes in the area
Home Values in the Area
Average Home Value in this Area
Purchase History
| Date | Buyer | Sale Price | Title Company |
|---|---|---|---|
| Cella Shaun Michael | $184,000 | Crescent Title Llc |
Source: Public Records
Mortgage History
| Date | Status | Borrower | Loan Amount |
|---|---|---|---|
| Open | Cella Shaun Michael | $179,335 |
Source: Public Records
Tax History
| Year | Tax Paid | Tax Assessment Tax Assessment Total Assessment is a certain percentage of the fair market value that is determined by local assessors to be the total taxable value of land and additions on the property. | Land | Improvement |
|---|---|---|---|---|
| 2025 | $1,432 | $21,670 | $8,100 | $13,570 |
| 2024 | $1,432 | $21,670 | $8,100 | $13,570 |
| 2023 | $1,454 | $18,163 | $5,180 | $12,983 |
| 2022 | $2,124 | $18,163 | $5,180 | $12,983 |
| 2021 | $1,928 | $16,347 | $4,662 | $11,685 |
| 2020 | $2,146 | $18,163 | $5,180 | $12,983 |
| 2019 | $2,076 | $17,508 | $5,070 | $12,438 |
| 2018 | $2,060 | $17,508 | $5,070 | $12,438 |
| 2017 | $2,058 | $17,508 | $5,070 | $12,438 |
| 2016 | $2,066 | $17,508 | $5,070 | $12,438 |
| 2015 | $1,065 | $16,560 | $3,074 | $13,486 |
| 2014 | $1,026 | $16,560 | $3,074 | $13,486 |
| 2013 | $1,883 | $16,560 | $3,074 | $13,486 |
Source: Public Records
Map
Nearby Homes
Your Personal Tour Guide
Ask me questions while you tour the home.