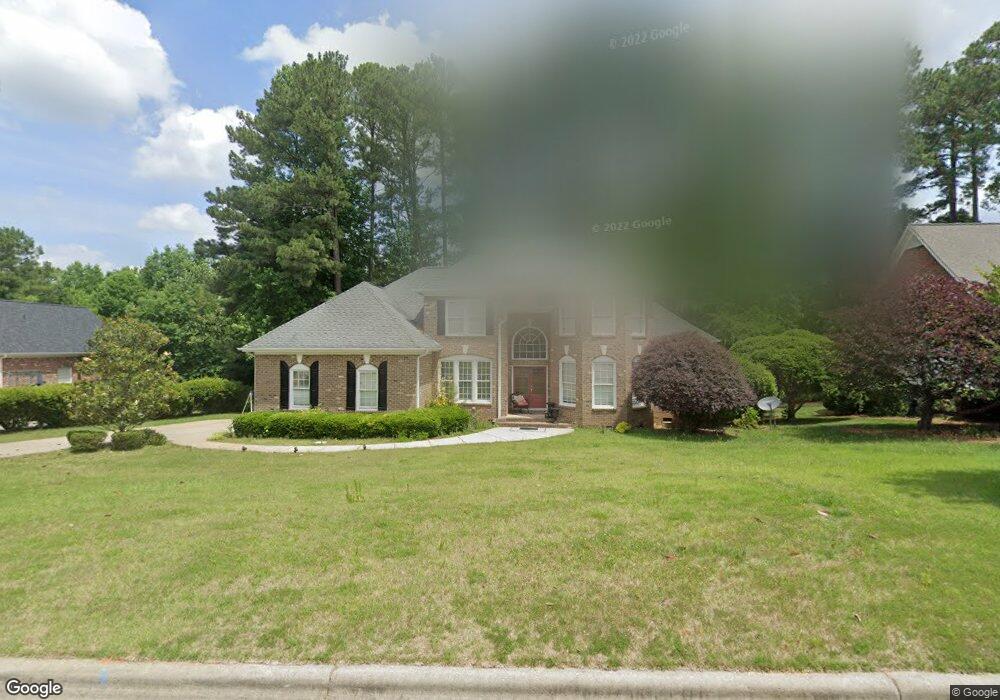
120 Monabreeze Way Garner, NC 27529
Estimated Value: $551,000 - $656,000
4
Beds
3
Baths
2,844
Sq Ft
$212/Sq Ft
Est. Value
About This Home
This home is located at 120 Monabreeze Way, Garner, NC 27529 and is currently estimated at $601,813, approximately $211 per square foot. 120 Monabreeze Way is a home located in Wake County with nearby schools including Timber Drive Elementary, North Garner Middle, and Garner High.
Ownership History
Date
Name
Owned For
Owner Type
Purchase Details
Closed on
Jun 9, 2020
Sold by
Opendoor Property Trust I
Bought by
Janajra Jehad and Janajra Safa
Current Estimated Value
Home Financials for this Owner
Home Financials are based on the most recent Mortgage that was taken out on this home.
Original Mortgage
$338,490
Outstanding Balance
$300,605
Interest Rate
3.3%
Mortgage Type
New Conventional
Estimated Equity
$301,208
Purchase Details
Closed on
Sep 30, 2019
Sold by
Bryan John F and Bryan Linda W
Bought by
Opendoor Property Trust I
Purchase Details
Closed on
Feb 19, 2004
Sold by
Dillon Construction Co Inc
Bought by
Bryan John F and Bryan Linda W
Home Financials for this Owner
Home Financials are based on the most recent Mortgage that was taken out on this home.
Original Mortgage
$243,550
Interest Rate
5.63%
Mortgage Type
Purchase Money Mortgage
Purchase Details
Closed on
Jul 22, 2002
Sold by
Breezeway Iv Llc
Bought by
Dillon Construction Company Inc
Create a Home Valuation Report for This Property
The Home Valuation Report is an in-depth analysis detailing your home's value as well as a comparison with similar homes in the area
Home Values in the Area
Average Home Value in this Area
Purchase History
| Date | Buyer | Sale Price | Title Company |
|---|---|---|---|
| Janajra Jehad | $356,500 | None Available | |
| Opendoor Property Trust I | $393,500 | None Available | |
| Bryan John F | $389,000 | -- | |
| Dillon Construction Company Inc | $55,000 | -- |
Source: Public Records
Mortgage History
| Date | Status | Borrower | Loan Amount |
|---|---|---|---|
| Open | Janajra Jehad | $338,490 | |
| Previous Owner | Bryan John F | $243,550 |
Source: Public Records
Tax History Compared to Growth
Tax History
| Year | Tax Paid | Tax Assessment Tax Assessment Total Assessment is a certain percentage of the fair market value that is determined by local assessors to be the total taxable value of land and additions on the property. | Land | Improvement |
|---|---|---|---|---|
| 2025 | $5,876 | $564,625 | $125,000 | $439,625 |
| 2024 | $5,855 | $564,625 | $125,000 | $439,625 |
| 2023 | $5,386 | $417,912 | $85,000 | $332,912 |
| 2022 | $4,916 | $417,912 | $85,000 | $332,912 |
| 2021 | $4,668 | $417,912 | $85,000 | $332,912 |
| 2020 | $4,605 | $417,912 | $85,000 | $332,912 |
| 2019 | $4,865 | $368,082 | $76,000 | $292,082 |
| 2018 | $4,389 | $368,082 | $76,000 | $292,082 |
| 2017 | $4,244 | $368,082 | $76,000 | $292,082 |
| 2016 | $4,190 | $368,082 | $76,000 | $292,082 |
| 2015 | $4,883 | $429,595 | $94,000 | $335,595 |
| 2014 | $4,651 | $429,595 | $94,000 | $335,595 |
Source: Public Records
Map
Nearby Homes
- 715 Thompson Rd
- 721 Thompson Rd
- 725 Thompson Rd
- 2205 Moon Water Way
- 1302 Buffaloe Rd
- 106 Teak Cir
- 1801 Blanton St
- 915 Flanders St
- 2006 Gottwald Ct
- 428 Grand Pointe Dr Unit 803
- 220 Grand Pointe Dr
- 107 Coachman Dr
- 112 Lager Ln
- 1400 Woods Creek Dr
- 100 Lager Ln
- 1308 Claymore Dr
- 1882 Lennox Dr
- 113 Heatherwood Dr
- 1607 Sycamore Dr
- 111 Clayfield Dr
- 116 Monabreeze Way
- 124 Monabreeze Way
- 131 Briar Rose Ln
- LOT 6 Monobreeze Way
- LOT 34 Monobreeze Way
- 0 Monobreeze Way
- 121 Monabreeze Way
- 125 Briar Rose Ln
- 112 Monabreeze Way
- 128 Monabreeze Way
- 128 Monobreeze Way
- 117 Monabreeze Way
- 125 Monabreeze Way
- 136 Briar Rose Ln
- 113 Monabreeze Way
- 132 Luxorwind Dr
- 119 Briar Rose Ln
- 108 Monabreeze Way
- 130 Briar Rose Ln
- 124 Luxorwind Dr