Estimated Value: $926,000
Studio
--
Bath
5,704
Sq Ft
$162/Sq Ft
Est. Value
About This Home
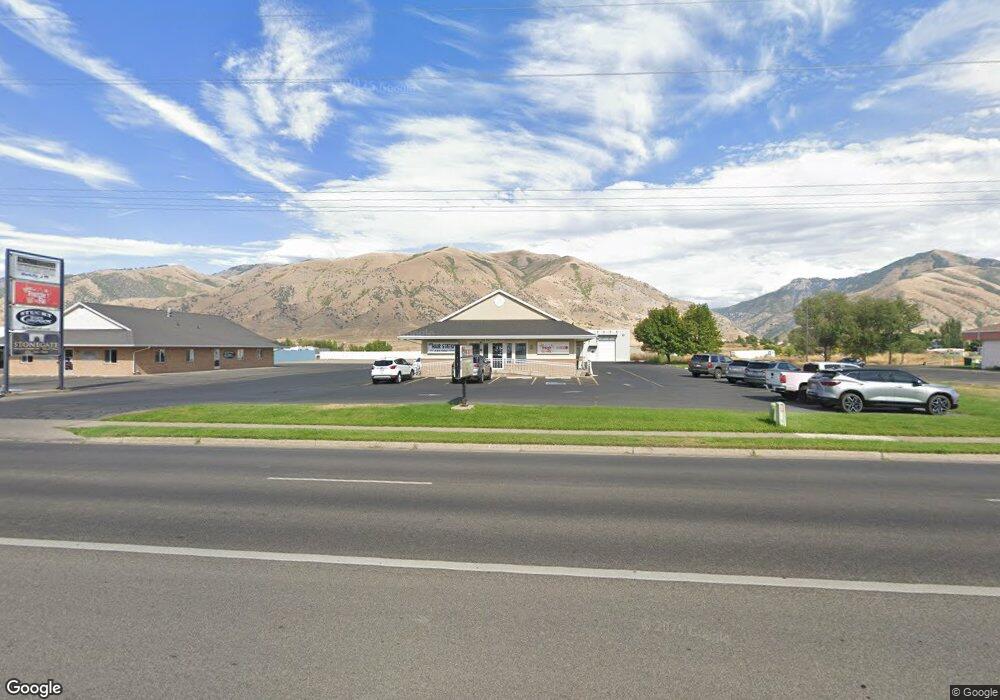
This home is located at 120 N 800 E, Hyrum, UT 84319 and is currently priced at $926,000, approximately $162 per square foot. 120 N 800 E is a home located in Cache County with nearby schools including Heritage School, South Cache Middle School, and Spring Creek Middle School.
Ownership History
Date
Name
Owned For
Owner Type
Purchase Details
Closed on
Feb 24, 2012
Sold by
Leishman Roland and Leishman Ruth
Bought by
Eagleray Holdings Llc
Current Estimated Value
Home Financials for this Owner
Home Financials are based on the most recent Mortgage that was taken out on this home.
Original Mortgage
$258,612
Outstanding Balance
$176,105
Interest Rate
3.84%
Mortgage Type
Seller Take Back
Purchase Details
Closed on
Jun 13, 2011
Sold by
Leishman Jay Grant and Leishman Trisha
Bought by
Leishman Roland and Leishman Ruth
Create a Home Valuation Report for This Property
The Home Valuation Report is an in-depth analysis detailing your home's value as well as a comparison with similar homes in the area
Home Values in the Area
Average Home Value in this Area
Purchase History
| Date | Buyer | Sale Price | Title Company |
|---|---|---|---|
| Eagleray Holdings Llc | -- | Northern Title Company | |
| Leishman Roland | -- | Northern Title Company |
Source: Public Records
Mortgage History
| Date | Status | Borrower | Loan Amount |
|---|---|---|---|
| Open | Eagleray Holdings Llc | $258,612 |
Source: Public Records
Tax History
| Year | Tax Paid | Tax Assessment Tax Assessment Total Assessment is a certain percentage of the fair market value that is determined by local assessors to be the total taxable value of land and additions on the property. | Land | Improvement |
|---|---|---|---|---|
| 2025 | $7,371 | $1,058,312 | $248,292 | $810,020 |
| 2024 | $8,215 | $1,101,485 | $248,292 | $853,193 |
| 2023 | $3,892 | $498,960 | $217,245 | $281,715 |
| 2022 | $3,977 | $488,615 | $206,900 | $281,715 |
| 2021 | $456 | $475,200 | $206,900 | $268,300 |
| 2020 | $4,864 | $475,200 | $206,900 | $268,300 |
| 2019 | $4,834 | $444,174 | $175,874 | $268,300 |
| 2018 | $4,917 | $436,768 | $168,468 | $268,300 |
| 2017 | $5,175 | $433,770 | $0 | $0 |
| 2016 | $5,292 | $433,770 | $0 | $0 |
| 2015 | $5,475 | $447,625 | $0 | $0 |
| 2014 | $5,354 | $447,625 | $0 | $0 |
| 2013 | -- | $410,595 | $0 | $0 |
Source: Public Records
Map
Nearby Homes
Your Personal Tour Guide
Ask me questions while you tour the home.