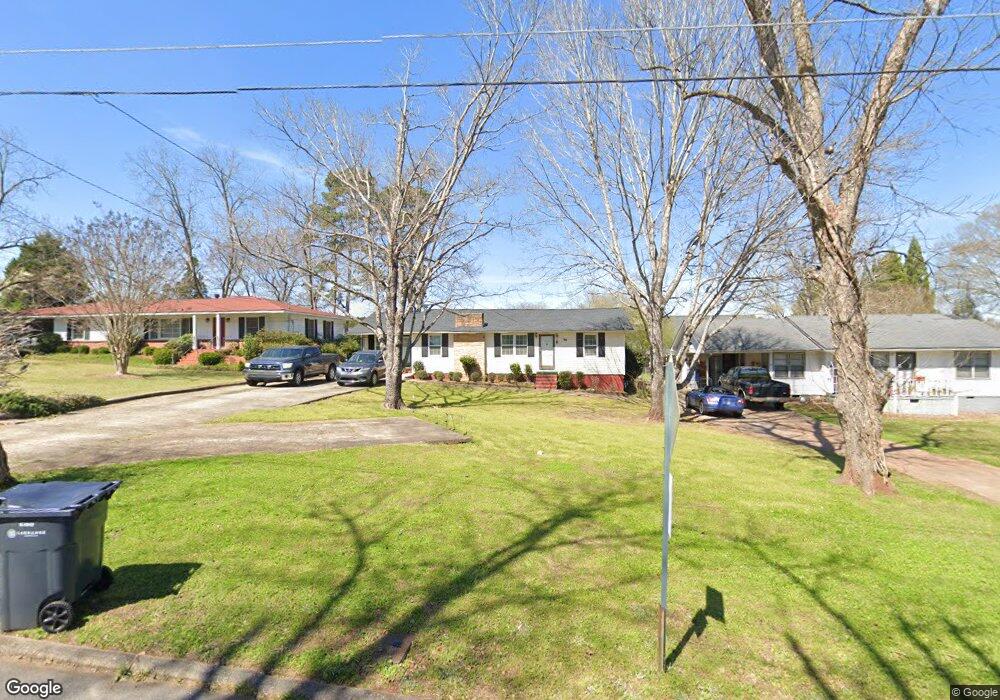
120 N Chilton Crescent Lagrange, GA 30240
Estimated Value: $173,518 - $198,000
3
Beds
1
Bath
1,462
Sq Ft
$127/Sq Ft
Est. Value
About This Home
This home is located at 120 N Chilton Crescent, Lagrange, GA 30240 and is currently estimated at $185,380, approximately $126 per square foot. 120 N Chilton Crescent is a home located in Troup County with nearby schools including Franklin Forest Elementary School, Hollis Hand Elementary School, and Ethel W. Kight Elementary School.
Ownership History
Date
Name
Owned For
Owner Type
Purchase Details
Closed on
Feb 29, 2024
Sold by
Jtc Partners Llc
Bought by
Thompson Connie and Thompson Emmanuel
Current Estimated Value
Home Financials for this Owner
Home Financials are based on the most recent Mortgage that was taken out on this home.
Original Mortgage
$150,000
Outstanding Balance
$147,505
Interest Rate
6.63%
Mortgage Type
New Conventional
Estimated Equity
$37,875
Purchase Details
Closed on
Jul 25, 2012
Sold by
Lee Mary Ann
Bought by
Jtc Partners Llc
Purchase Details
Closed on
Mar 6, 1990
Sold by
Veal Agnes Moore
Bought by
Lee Mary Ann
Purchase Details
Closed on
Aug 2, 1977
Sold by
Veal Emmmett Ford
Bought by
Veal Agnes Moore
Purchase Details
Closed on
Jul 1, 1966
Sold by
Sanders Agnes M
Bought by
Veal Emmmett Ford
Create a Home Valuation Report for This Property
The Home Valuation Report is an in-depth analysis detailing your home's value as well as a comparison with similar homes in the area
Home Values in the Area
Average Home Value in this Area
Purchase History
| Date | Buyer | Sale Price | Title Company |
|---|---|---|---|
| Thompson Connie | $150,000 | -- | |
| Jtc Partners Llc | $57,000 | -- | |
| Lee Mary Ann | -- | -- | |
| Veal Agnes Moore | -- | -- | |
| Veal Emmmett Ford | -- | -- |
Source: Public Records
Mortgage History
| Date | Status | Borrower | Loan Amount |
|---|---|---|---|
| Open | Thompson Connie | $150,000 |
Source: Public Records
Tax History Compared to Growth
Tax History
| Year | Tax Paid | Tax Assessment Tax Assessment Total Assessment is a certain percentage of the fair market value that is determined by local assessors to be the total taxable value of land and additions on the property. | Land | Improvement |
|---|---|---|---|---|
| 2024 | $1,503 | $55,104 | $4,400 | $50,704 |
| 2023 | $937 | $34,344 | $4,400 | $29,944 |
| 2022 | $915 | $32,784 | $4,400 | $28,384 |
| 2021 | $742 | $24,616 | $4,400 | $20,216 |
| 2020 | $742 | $24,616 | $4,400 | $20,216 |
| 2019 | $683 | $22,648 | $4,400 | $18,248 |
| 2018 | $677 | $22,448 | $4,200 | $18,248 |
| 2017 | $677 | $22,448 | $4,200 | $18,248 |
| 2016 | $659 | $21,839 | $4,200 | $17,639 |
| 2015 | $666 | $22,041 | $4,402 | $17,639 |
| 2014 | $639 | $21,112 | $4,402 | $16,711 |
| 2013 | -- | $22,476 | $4,402 | $18,074 |
Source: Public Records
Map
Nearby Homes
- 106 S Chilton Crescent
- 201 S Chilton Crescent
- 100 Creekside Dr Unit LOT 60A
- 203 S Chilton Crescent
- 107 Dixie Creek Dr
- 724 Camellia Dr
- 106 Ewing St
- 102 Ewing St
- 145 Turner St
- 748 Lakewood Dr
- 204 Colonial St
- 110 Russell St
- 806 New Franklin Rd
- 114 Briarcliff Rd
- 900 North St
- 127 Ashling Dr
- 134 S Page St
- 109 Thomas St
- 89 Chase Rd
- 400 S Page St
- 118 N Chilton Crescent
- 122 N Chilton Crescent
- 114 N Chilton Crescent
- 154 Wisteria Ridge Terrace
- 158 Wisteria Ridge Terrace
- 152 Wisteria Ridge Terrace
- 160 Wisteria Ridge Terrace
- 150 Wisteria Ridge Terrace Unit 26
- 150 Wisteria Ridge Terrace
- 150 Wisteria Unit 26
- 119 N Chilton Crescent
- 121 N Chilton Crescent
- 126 N Chilton Crescent
- 0 N Chilton Crescent
- 112 N Chilton Crescent
- 123 N Chilton Crescent
- N N Chilton Crescent Unit 4
- N N Chilton Crescent
- 162 Wisteria Ridge Terrace
- 148 Wisteria Ridge Terrace