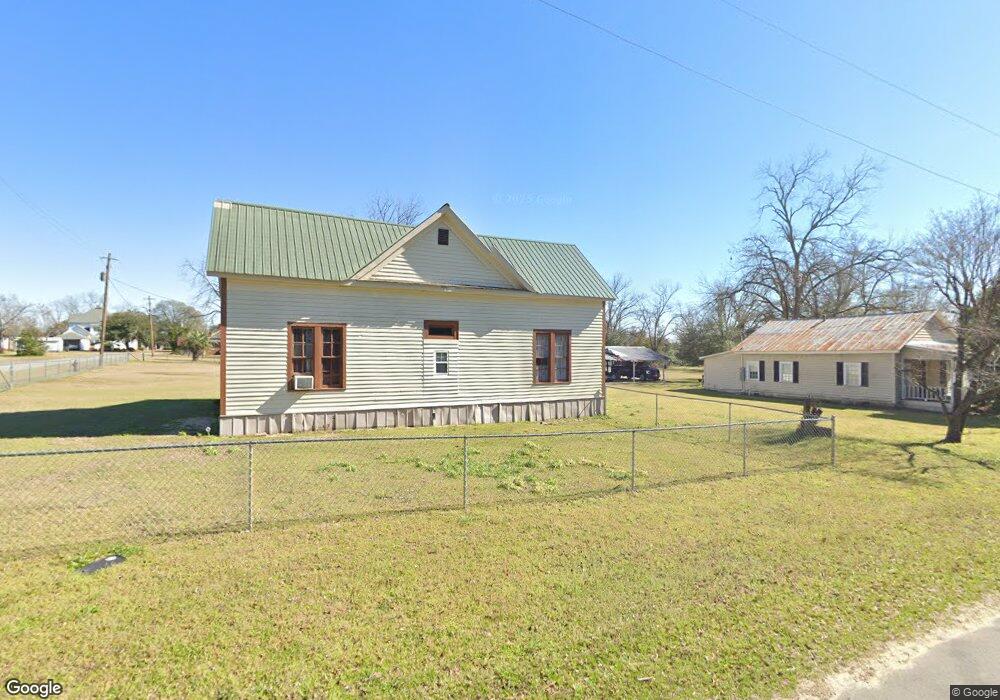
120 N Thomas St Davisboro, GA 31018
Estimated Value: $64,000 - $130,000
Studio
--
Bath
1,378
Sq Ft
$65/Sq Ft
Est. Value
About This Home
This home is located at 120 N Thomas St, Davisboro, GA 31018 and is currently estimated at $90,178, approximately $65 per square foot. 120 N Thomas St is a home located in Washington County with nearby schools including Ridge Road Primary School, Ridge Road Elementary School, and T.J. Elder Middle School.
Ownership History
Date
Name
Owned For
Owner Type
Purchase Details
Closed on
Jan 11, 2022
Sold by
Frank William Bernard
Bought by
Thomas Ellean
Current Estimated Value
Home Financials for this Owner
Home Financials are based on the most recent Mortgage that was taken out on this home.
Original Mortgage
$52,910
Outstanding Balance
$48,537
Interest Rate
3.22%
Mortgage Type
Cash
Estimated Equity
$41,641
Purchase Details
Closed on
Oct 24, 2005
Sold by
Ridgeway Hurley
Bought by
Godin Edward C and Godin Barbara F
Purchase Details
Closed on
Sep 20, 2000
Sold by
Reynolds Allen
Bought by
Ridgeway Hurley
Purchase Details
Closed on
May 1, 1983
Bought by
Reynolds Allen
Purchase Details
Closed on
Oct 19, 1982
Sold by
Avant Clark
Bought by
Reynolds Allen
Purchase Details
Closed on
Aug 20, 1982
Sold by
Stovall David
Bought by
Reynolds Allen
Create a Home Valuation Report for This Property
The Home Valuation Report is an in-depth analysis detailing your home's value as well as a comparison with similar homes in the area
Purchase History
| Date | Buyer | Sale Price | Title Company |
|---|---|---|---|
| Thomas Ellean | $52,000 | -- | |
| Godin Edward C | $39,000 | -- | |
| Ridgeway Hurley | $5,500 | -- | |
| Reynolds Allen | -- | -- | |
| Reynolds Allen | -- | -- | |
| Avant Clark | -- | -- | |
| Reynolds Allen | -- | -- |
Source: Public Records
Mortgage History
| Date | Status | Borrower | Loan Amount |
|---|---|---|---|
| Open | Thomas Ellean | $52,910 |
Source: Public Records
Tax History
| Year | Tax Paid | Tax Assessment Tax Assessment Total Assessment is a certain percentage of the fair market value that is determined by local assessors to be the total taxable value of land and additions on the property. | Land | Improvement |
|---|---|---|---|---|
| 2025 | $789 | $25,760 | $920 | $24,840 |
| 2024 | $976 | $25,760 | $920 | $24,840 |
| 2023 | $628 | $18,360 | $920 | $17,440 |
| 2022 | $583 | $18,760 | $1,320 | $17,440 |
| 2021 | $597 | $18,760 | $1,320 | $17,440 |
| 2020 | $602 | $18,760 | $1,320 | $17,440 |
| 2019 | $601 | $18,760 | $1,320 | $17,440 |
| 2018 | $602 | $18,760 | $1,320 | $17,440 |
| 2017 | $580 | $18,957 | $1,243 | $17,714 |
| 2016 | $601 | $18,957 | $1,243 | $17,714 |
| 2015 | $541 | $806 | $1,243 | $17,714 |
| 2014 | $541 | $19,650 | $1,936 | $17,714 |
| 2013 | $541 | $19,650 | $1,935 | $17,714 |
Source: Public Records
Map
Nearby Homes
- Lt.1 Harrison-Davisboro Rd
- 7 Sun Hill Grange Rd
- 4 Sun Hill Grange Rd
- 3033 Freetown Rd
- 0 Glover Rd
- 0 Belmont Rd N Unit 10684732
- Tbd Belmont Rd
- 265 Jordan Meadow Ln
- 9357 E Highway 242
- 3841 Wilson Rd
- 00 Henderson Grove Rd
- 8849 Sunhill Rd
- 3195 Henderson Grove Rd
- 1102 Friendship Church Rd
- 2905 Donald Cobb Rd
- 2160 Donald Cobb Rd
- 0 Mathis Rd Unit 10677378
- 0 Mathis Rd Unit 54347
- 0 Newman Smith Rd Unit 10573699
- 0 Newman Smith Rd Unit 24281399
- 116 N Thomas St
- 112 N Thomas St
- 121 N Thomas St
- 201 N Thomas St
- 209 N Thomas St
- 131 N Main St
- 117 N Thomas St
- 214 N Thomas St
- 119 N Main St
- 213 N Thomas St
- 110 Horton St
- N N Thomas St
- 214 Dillard St
- 202 Dillard St
- 107 N Thomas St
- 203 N Main St
- 215 N Thomas St
- 211 N Thomas St
- 114 W Brown Dr
- 210 Dillard St
Your Personal Tour Guide
Ask me questions while you tour the home.