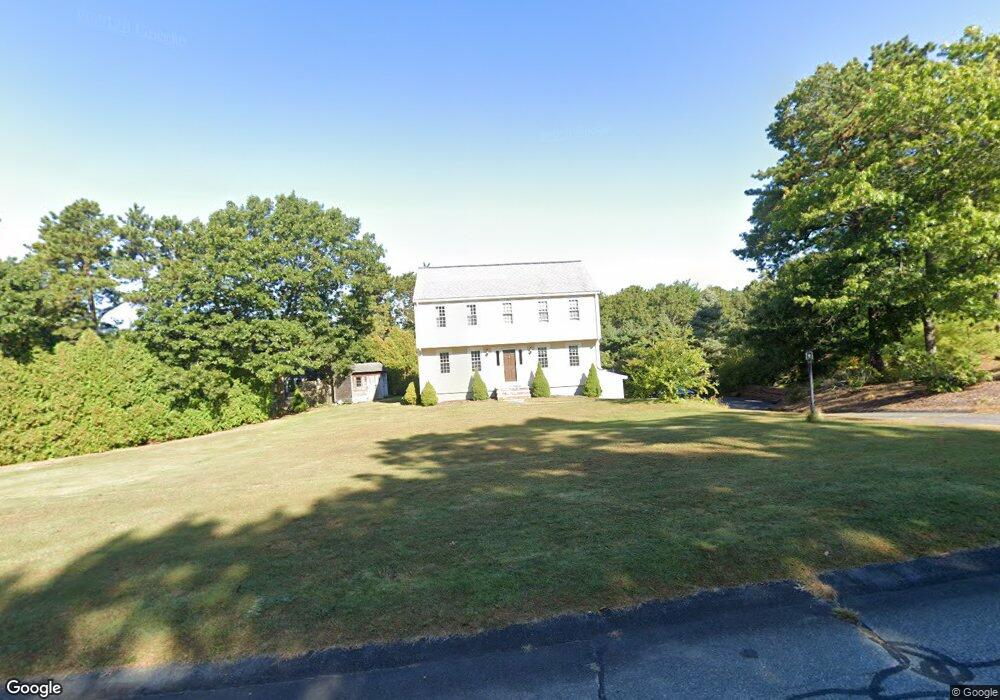
120 N Triangle Dr Plymouth, MA 02360
Estimated Value: $711,000 - $835,000
4
Beds
3
Baths
2,444
Sq Ft
$321/Sq Ft
Est. Value
About This Home
This home is located at 120 N Triangle Dr, Plymouth, MA 02360 and is currently estimated at $784,435, approximately $320 per square foot. 120 N Triangle Dr is a home located in Plymouth County with nearby schools including West Elementary School, Plymouth Community Intermediate, and Plymouth North High School.
Ownership History
Date
Name
Owned For
Owner Type
Purchase Details
Closed on
Aug 3, 2021
Sold by
Grant Christopher R
Bought by
R Grant T C
Current Estimated Value
Purchase Details
Closed on
Mar 5, 2014
Sold by
Grant Christopher R and Grant Rachelle D
Bought by
Grant Christopher R
Purchase Details
Closed on
Aug 25, 2011
Sold by
Connelly Amy B
Bought by
Grant Christopher R and Grant Rachelle D
Home Financials for this Owner
Home Financials are based on the most recent Mortgage that was taken out on this home.
Original Mortgage
$278,000
Interest Rate
4.53%
Mortgage Type
Purchase Money Mortgage
Purchase Details
Closed on
May 27, 2010
Sold by
Baker Joseph W and Baker Teresa M
Bought by
Connelly Amy B
Home Financials for this Owner
Home Financials are based on the most recent Mortgage that was taken out on this home.
Original Mortgage
$375,550
Interest Rate
5.13%
Mortgage Type
Purchase Money Mortgage
Create a Home Valuation Report for This Property
The Home Valuation Report is an in-depth analysis detailing your home's value as well as a comparison with similar homes in the area
Home Values in the Area
Average Home Value in this Area
Purchase History
| Date | Buyer | Sale Price | Title Company |
|---|---|---|---|
| R Grant T C | -- | None Available | |
| Grant Christopher R | -- | -- | |
| Grant Christopher R | $378,000 | -- | |
| Connelly Amy B | $395,000 | -- |
Source: Public Records
Mortgage History
| Date | Status | Borrower | Loan Amount |
|---|---|---|---|
| Previous Owner | Grant Christopher R | $278,000 | |
| Previous Owner | Connelly Amy B | $375,550 |
Source: Public Records
Tax History Compared to Growth
Tax History
| Year | Tax Paid | Tax Assessment Tax Assessment Total Assessment is a certain percentage of the fair market value that is determined by local assessors to be the total taxable value of land and additions on the property. | Land | Improvement |
|---|---|---|---|---|
| 2025 | $8,525 | $671,800 | $284,700 | $387,100 |
| 2024 | $8,053 | $625,700 | $270,300 | $355,400 |
| 2023 | $7,778 | $567,300 | $246,300 | $321,000 |
| 2022 | $6,755 | $437,800 | $222,300 | $215,500 |
| 2021 | $6,697 | $414,400 | $222,300 | $192,100 |
| 2020 | $6,700 | $409,800 | $219,100 | $190,700 |
| 2019 | $6,396 | $386,700 | $194,100 | $192,600 |
| 2018 | $6,148 | $373,500 | $181,600 | $191,900 |
| 2017 | $5,831 | $351,700 | $174,300 | $177,400 |
| 2016 | $5,654 | $347,500 | $168,300 | $179,200 |
| 2015 | $5,543 | $356,700 | $175,800 | $180,900 |
| 2014 | $5,208 | $344,200 | $162,300 | $181,900 |
Source: Public Records
Map
Nearby Homes
- 7 W Hill Rd
- 16 Jan Marie Dr
- 198 Samoset St
- 116 Pilgrim Trail
- 5 Marc Dr Unit 1
- 5 Marc Dr Unit 5
- 5 Marc Dr Unit 8
- 2 Marc Dr Unit 2B2
- 4 Marc Dr Unit 4B3
- 144 Industrial Park Rd
- 62 Jan Marie Dr
- 3 Winter Hollow
- 6 Stone Gate Dr
- 2 Mariner's Way Unit 301
- 16 Filmore St
- 166 Carver Rd
- 15 Sansome St
- 0 Nathaniel St
- 230 Summer St
- 52 Liberty St Unit J5
- 110 N Triangle Dr
- 128 N Triangle Dr
- 121 N Triangle Dr
- 125 N Triangle Dr
- 132 N Triangle Dr
- 117 N Triangle Dr
- 111 N Triangle Dr
- 2 Triphammer Cir
- 129 N Triangle Dr
- 96 N Triangle Dr
- 6 Triphammer Cir
- 136 N Triangle Dr
- 109 N Triangle Dr
- 135 N Triangle Dr
- 105 N Triangle Dr
- 92 N Triangle Dr
- 7 Triphammer Cir
- 101 N Triangle Dr
- 139 N Triangle Dr
- 20 N Triangle Dr