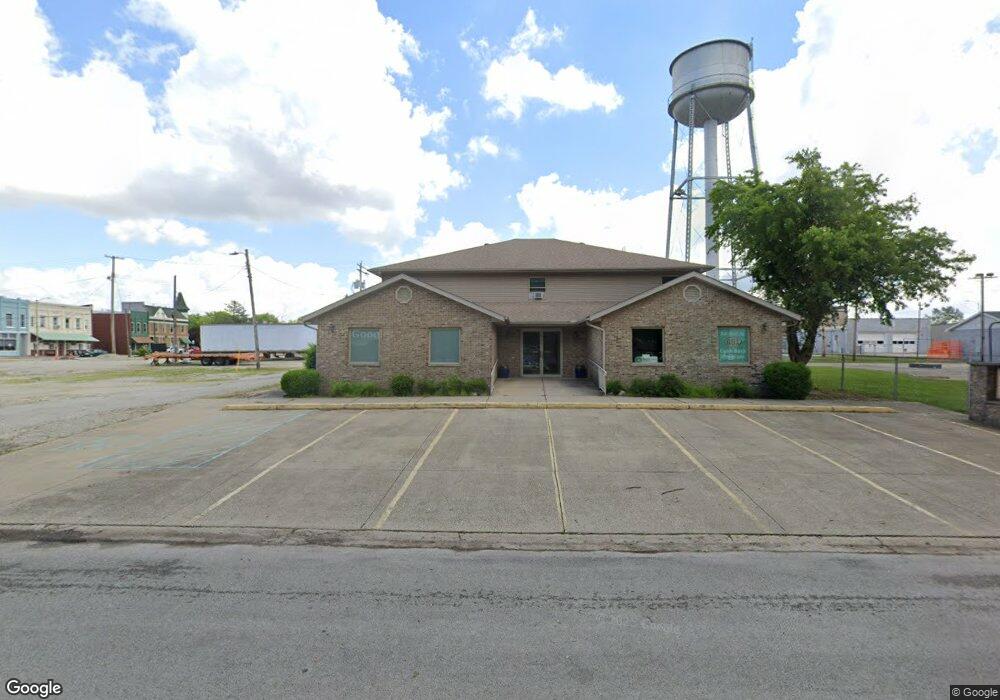
120 N Walnut St Assumption, IL 62510
Estimated Value: $142,000 - $149,000
4
Beds
1
Bath
1,622
Sq Ft
$90/Sq Ft
Est. Value
About This Home
This home is located at 120 N Walnut St, Assumption, IL 62510 and is currently estimated at $145,192, approximately $89 per square foot. 120 N Walnut St is a home located in Christian County with nearby schools including Central A&M High School and Kemmerer Village School.
Ownership History
Date
Name
Owned For
Owner Type
Purchase Details
Closed on
Aug 10, 2023
Sold by
Lourash Samantha
Bought by
Gideon Rhayden and Herman Kennedy
Current Estimated Value
Home Financials for this Owner
Home Financials are based on the most recent Mortgage that was taken out on this home.
Original Mortgage
$118,808
Outstanding Balance
$116,258
Interest Rate
7.13%
Mortgage Type
FHA
Estimated Equity
$28,934
Purchase Details
Closed on
Jun 19, 2021
Sold by
Groves Michael W and Groves Gavin J
Bought by
Lourash Samantha
Home Financials for this Owner
Home Financials are based on the most recent Mortgage that was taken out on this home.
Original Mortgage
$94,848
Interest Rate
2.9%
Mortgage Type
Stand Alone Refi Refinance Of Original Loan
Purchase Details
Closed on
Aug 1, 2003
Bought by
Zahradka Rudy J
Create a Home Valuation Report for This Property
The Home Valuation Report is an in-depth analysis detailing your home's value as well as a comparison with similar homes in the area
Home Values in the Area
Average Home Value in this Area
Purchase History
| Date | Buyer | Sale Price | Title Company |
|---|---|---|---|
| Gideon Rhayden | $121,000 | Advanced Title | |
| Lourash Samantha | $94,500 | None Available | |
| Zahradka Rudy J | $29,000 | -- |
Source: Public Records
Mortgage History
| Date | Status | Borrower | Loan Amount |
|---|---|---|---|
| Open | Gideon Rhayden | $118,808 | |
| Previous Owner | Lourash Samantha | $94,848 |
Source: Public Records
Tax History Compared to Growth
Tax History
| Year | Tax Paid | Tax Assessment Tax Assessment Total Assessment is a certain percentage of the fair market value that is determined by local assessors to be the total taxable value of land and additions on the property. | Land | Improvement |
|---|---|---|---|---|
| 2024 | $3,109 | $43,039 | $2,895 | $40,144 |
| 2023 | $2,929 | $40,333 | $2,713 | $37,620 |
| 2022 | $503 | $16,558 | $2,521 | $14,037 |
| 2021 | $464 | $15,883 | $2,418 | $13,465 |
| 2020 | $463 | $15,883 | $2,418 | $13,465 |
| 2019 | $478 | $15,963 | $2,430 | $13,533 |
| 2018 | $426 | $11,046 | $2,351 | $8,695 |
| 2017 | $395 | $10,637 | $2,264 | $8,373 |
| 2016 | $890 | $10,429 | $2,220 | $8,209 |
| 2015 | $348 | $10,015 | $2,132 | $7,883 |
| 2014 | $819 | $9,804 | $2,087 | $7,717 |
| 2013 | $818 | $15,744 | $2,087 | $13,657 |
| 2011 | $810 | $15,744 | $2,087 | $13,657 |
Source: Public Records
Map
Nearby Homes
- 120 S Walnut St
- 116 S Saint John St
- 107 S Saint John St
- 113 S Poplar St
- 325 N Poplar St
- Lot 2 Baxmeyer Ln
- Lot 15 Baxmeyer Ln
- Lot 9 Baxmeyer Ln
- Lot 4 Baxmeyer Ln
- Lot 14 Baxmeyer Ln
- Lot 11 Baxmeyer Ln
- Lot 6 Baxmeyer Ln
- Lot 8 Baxmeyer Ln
- Lot 12 Baxmeyer Ln
- Lot 7 Baxmeyer Ln
- Lot 13 Baxmeyer Ln
- Lot 10 Baxmeyer Ln
- Lot 5 Baxmeyer Ln
- Lot 16 Baxmeyer Ln
- Lot 3 Baxmeyer Ln
- 105 N Walnut St
- 118 N Walnut St
- 109 N Walnut St
- 106 S Walnut St
- 103 W 2nd St
- 117 N Chestnut St
- 113 N Chestnut St
- 107 N Chestnut St
- 119 N Chestnut St
- 117 W 1st St
- 103 S Walnut St
- 123 N Chestnut St
- 103 S Chestnut St
- 114 S Walnut St
- 202 W 2nd St
- 107 S Walnut St
- 110 N Hickory St
- 201 W 2nd St
- 111 S Walnut St
- 118 S Walnut St