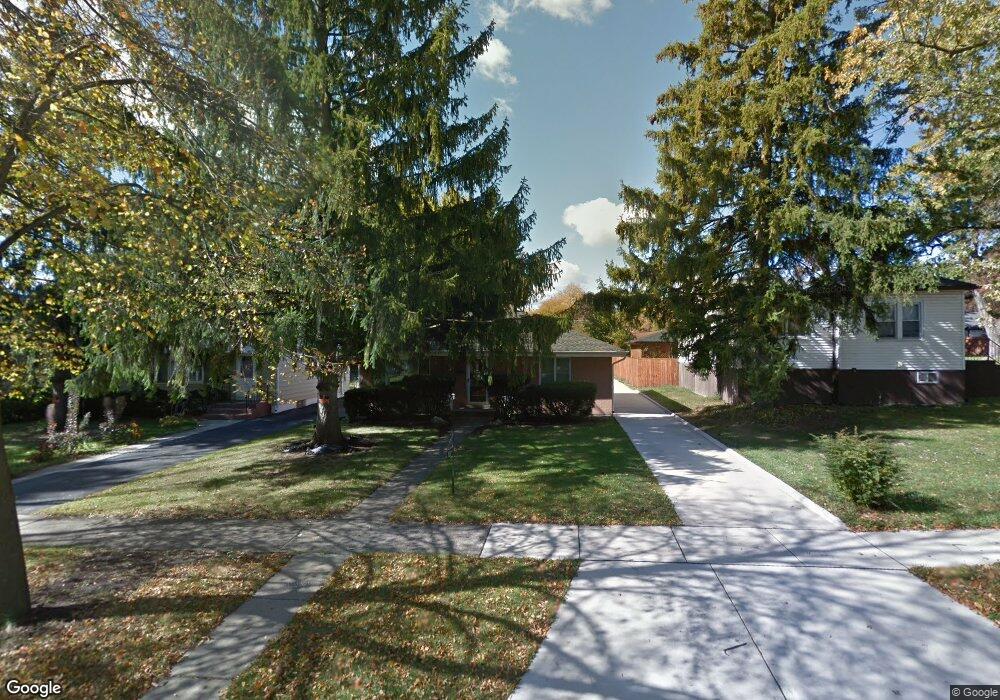
120 N Wisconsin Ave Villa Park, IL 60181
Estimated Value: $262,239 - $342,000
--
Bed
--
Bath
962
Sq Ft
$308/Sq Ft
Est. Value
About This Home
This home is located at 120 N Wisconsin Ave, Villa Park, IL 60181 and is currently estimated at $296,060, approximately $307 per square foot. 120 N Wisconsin Ave is a home located in DuPage County with nearby schools including North Elementary School, Jefferson Middle School, and Willowbrook High School.
Ownership History
Date
Name
Owned For
Owner Type
Purchase Details
Closed on
Nov 14, 2008
Sold by
Painter Robert L and Painter Christine B
Bought by
Painter Christine B
Current Estimated Value
Purchase Details
Closed on
Sep 10, 1998
Sold by
Burns Ruby
Bought by
Painter Robert L and Painter Christine B
Home Financials for this Owner
Home Financials are based on the most recent Mortgage that was taken out on this home.
Original Mortgage
$35,000
Outstanding Balance
$7,554
Interest Rate
7.02%
Estimated Equity
$288,506
Purchase Details
Closed on
Aug 23, 1996
Sold by
West Suburban Bank
Bought by
Painter Robert L and Painter Christine
Home Financials for this Owner
Home Financials are based on the most recent Mortgage that was taken out on this home.
Original Mortgage
$65,000
Interest Rate
8.3%
Create a Home Valuation Report for This Property
The Home Valuation Report is an in-depth analysis detailing your home's value as well as a comparison with similar homes in the area
Home Values in the Area
Average Home Value in this Area
Purchase History
| Date | Buyer | Sale Price | Title Company |
|---|---|---|---|
| Painter Christine B | -- | None Available | |
| Painter Robert L | -- | -- | |
| Painter Robert L | $120,000 | -- |
Source: Public Records
Mortgage History
| Date | Status | Borrower | Loan Amount |
|---|---|---|---|
| Open | Painter Robert L | $35,000 | |
| Previous Owner | Painter Robert L | $65,000 |
Source: Public Records
Tax History Compared to Growth
Tax History
| Year | Tax Paid | Tax Assessment Tax Assessment Total Assessment is a certain percentage of the fair market value that is determined by local assessors to be the total taxable value of land and additions on the property. | Land | Improvement |
|---|---|---|---|---|
| 2024 | $4,726 | $78,532 | $14,329 | $64,203 |
| 2023 | $4,433 | $72,620 | $13,250 | $59,370 |
| 2022 | $4,572 | $69,800 | $12,730 | $57,070 |
| 2021 | $2,145 | $68,060 | $12,410 | $55,650 |
| 2020 | $2,144 | $66,570 | $12,140 | $54,430 |
| 2019 | $2,112 | $63,290 | $11,540 | $51,750 |
| 2018 | $2,249 | $57,060 | $10,400 | $46,660 |
| 2017 | $2,312 | $54,370 | $9,910 | $44,460 |
| 2016 | $2,396 | $51,220 | $9,340 | $41,880 |
| 2015 | $2,551 | $47,720 | $8,700 | $39,020 |
| 2014 | $2,541 | $52,000 | $15,280 | $36,720 |
| 2013 | $2,385 | $52,730 | $15,490 | $37,240 |
Source: Public Records
Map
Nearby Homes
- 37 N Addison Rd
- 1136 E Kenilworth Ave
- 417 W Terrace St
- 935 E Saint Charles Rd
- 912 E Saint Charles Rd
- 131 N Chase Ave
- 736 E Saint Charles Rd
- 235 N Ardmore Ave
- 247 N Ardmore Ave
- 439 N Harvard Ave
- 700 W Pleasant St
- 118 S Highland Ave
- 58 E Division St
- 434 N Lincoln Ave
- 114 E Kenilworth Ave
- 125 S Chase Ave
- 208 S Highland Ave
- 82 S Lodge Ln
- 1041 E Division St
- 634 E Emerson Ave
- 124 N Wisconsin Ave
- 116 N Wisconsin Ave
- 110 N Wisconsin Ave
- 108 N Wisconsin Ave
- 200 N Wisconsin Ave
- 104 N Wisconsin Ave
- 206 N Wisconsin Ave
- 115 N Wisconsin Ave
- 119 N Addison Rd
- 309 W Elm St
- 343 W Elm St
- 107 N Wisconsin Ave
- 111 N Wisconsin Ave
- 203 N Wisconsin Ave
- 113 N Addison Rd
- 100 N Wisconsin Ave
- 109 N Addison Rd
- 210 N Wisconsin Ave
- 105 N Wisconsin Ave