Estimated Value: $155,000 - $175,000
2
Beds
1
Bath
1,041
Sq Ft
$155/Sq Ft
Est. Value
About This Home
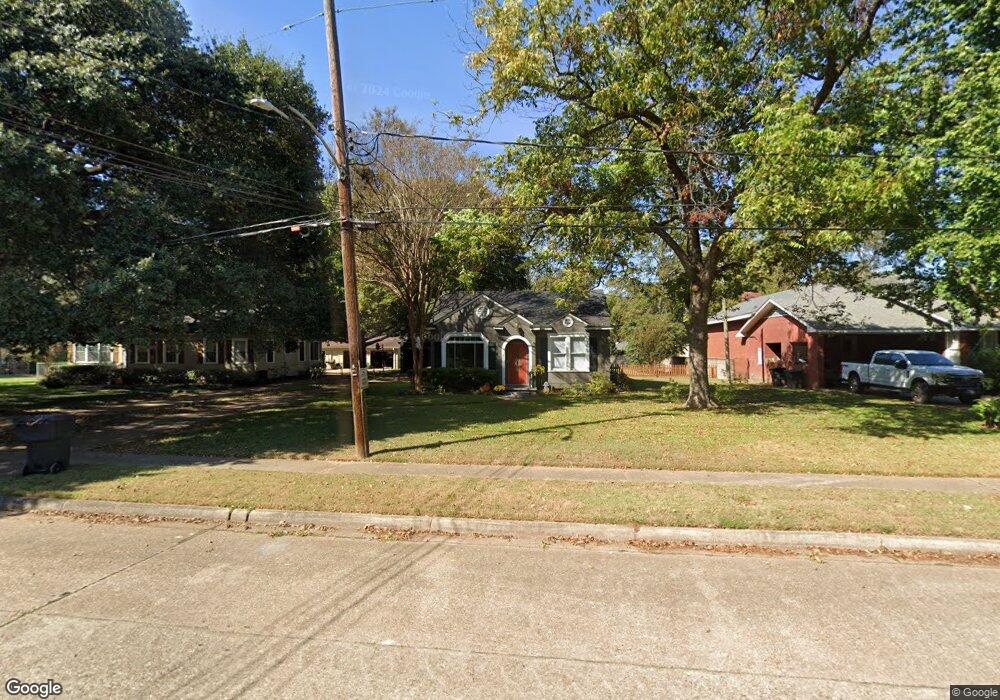
This home is located at 120 Ockley Dr, Shreveport, LA 71105 and is currently estimated at $161,685, approximately $155 per square foot. 120 Ockley Dr is a home located in Caddo Parish with nearby schools including Broadmoor STEM Academy, Fairfield Magnet School, and Claiborne Fundamental Elementary School.
Ownership History
Date
Name
Owned For
Owner Type
Purchase Details
Closed on
Jul 20, 2022
Sold by
Frank Flowers Daniel and Frank Dawn Tammy
Bought by
Conly Jake Scott and Conly Kaylee Flowers
Current Estimated Value
Purchase Details
Closed on
Oct 15, 2019
Sold by
Dunkelman Robert A and Dunkelman Kathrynn Baucum
Bought by
Flowers Daniel Frank and Flowers Tammy Dawn
Purchase Details
Closed on
Dec 13, 2012
Sold by
Cyrus John Wright Wells and Eskridge Sara Kathryn
Bought by
Dunkelman Robert A and Dunkelman Kathrynn Baucum
Purchase Details
Closed on
Jun 24, 2010
Sold by
Elmore David A and Elmore Julie A
Bought by
Kathryn Wells John Wright and Kathryn Eskiridge Sara
Home Financials for this Owner
Home Financials are based on the most recent Mortgage that was taken out on this home.
Original Mortgage
$123,339
Interest Rate
4.87%
Mortgage Type
FHA
Create a Home Valuation Report for This Property
The Home Valuation Report is an in-depth analysis detailing your home's value as well as a comparison with similar homes in the area
Home Values in the Area
Average Home Value in this Area
Purchase History
| Date | Buyer | Sale Price | Title Company |
|---|---|---|---|
| Conly Jake Scott | $145,800 | None Listed On Document | |
| Flowers Daniel Frank | $140,000 | None Available | |
| Dunkelman Robert A | $130,000 | None Available | |
| Kathryn Wells John Wright | $125,000 | None Available |
Source: Public Records
Mortgage History
| Date | Status | Borrower | Loan Amount |
|---|---|---|---|
| Previous Owner | Kathryn Wells John Wright | $123,339 |
Source: Public Records
Tax History Compared to Growth
Tax History
| Year | Tax Paid | Tax Assessment Tax Assessment Total Assessment is a certain percentage of the fair market value that is determined by local assessors to be the total taxable value of land and additions on the property. | Land | Improvement |
|---|---|---|---|---|
| 2024 | $1,594 | $10,225 | $3,383 | $6,842 |
| 2023 | $1,508 | $9,460 | $3,221 | $6,239 |
| 2022 | $1,508 | $9,460 | $3,221 | $6,239 |
| 2021 | $1,485 | $9,460 | $3,221 | $6,239 |
| 2020 | $1,485 | $9,460 | $3,221 | $6,239 |
| 2019 | $1,516 | $9,372 | $3,221 | $6,151 |
| 2018 | $1,207 | $9,372 | $3,221 | $6,151 |
| 2017 | $1,540 | $9,372 | $3,221 | $6,151 |
| 2015 | $1,261 | $9,730 | $3,220 | $6,510 |
| 2014 | $1,271 | $9,730 | $3,220 | $6,510 |
| 2013 | -- | $9,730 | $3,220 | $6,510 |
Source: Public Records
Map
Nearby Homes
- 129 Ardmore Ave
- 754 E Kings Hwy
- 187 Atlantic Ave
- 902 Anniston Ave
- 171 Archer Ave
- 951 Audubon Place
- 110 Archer Ave
- 3541 Greenway Place
- 3529 Greenway Place
- 3715 Greenway Place
- 110 Preston Ave
- 202 Preston Ave
- 3712 Greenway Place
- 3010 W Cavett Dr
- 3435 Broadmoor Blvd
- 3011 W Cavett Dr
- 850 Cardinal St
- 107 Preston Ave
- 879 Sewanee Place
- 846 Robards St