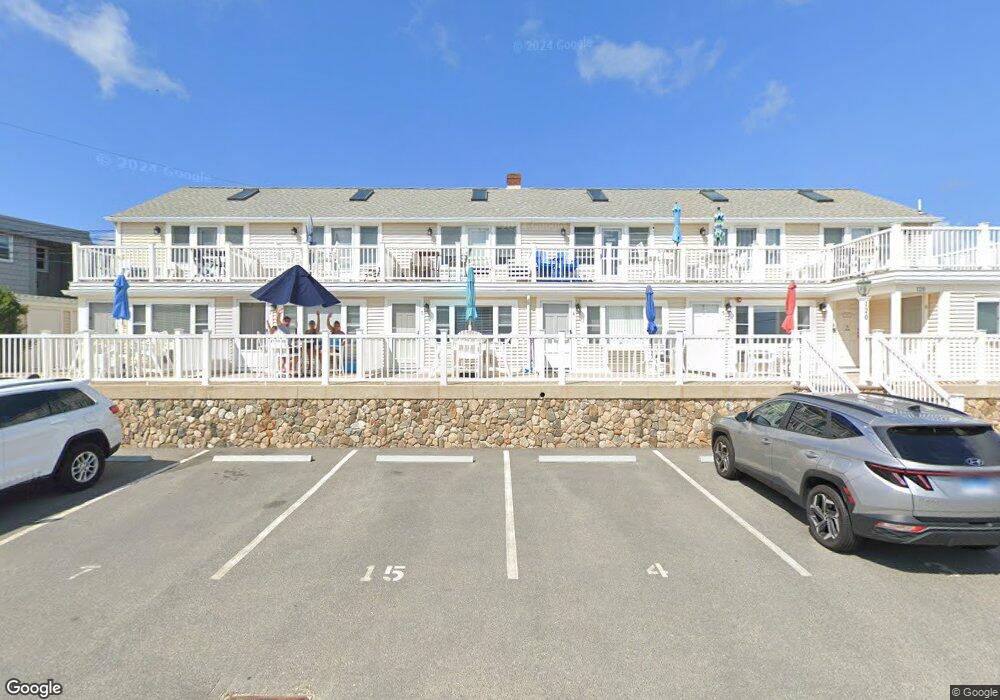
120 Old Wharf Rd Unit 1 Dennis Port, MA 02639
Dennis Port NeighborhoodEstimated Value: $317,904 - $334,000
1
Bed
1
Bath
650
Sq Ft
$498/Sq Ft
Est. Value
About This Home
This home is located at 120 Old Wharf Rd Unit 1, Dennis Port, MA 02639 and is currently estimated at $323,476, approximately $497 per square foot. 120 Old Wharf Rd Unit 1 is a home located in Barnstable County with nearby schools including Dennis-Yarmouth Regional High School and St. Pius X. School.
Ownership History
Date
Name
Owned For
Owner Type
Purchase Details
Closed on
Nov 8, 2002
Sold by
Webber-Segal Deborah
Bought by
Franco Lee V and Franco Lisa M
Current Estimated Value
Home Financials for this Owner
Home Financials are based on the most recent Mortgage that was taken out on this home.
Original Mortgage
$113,850
Interest Rate
6.04%
Mortgage Type
Purchase Money Mortgage
Purchase Details
Closed on
Sep 7, 2001
Sold by
Rossiter Bruce
Bought by
Segal Deborah W
Home Financials for this Owner
Home Financials are based on the most recent Mortgage that was taken out on this home.
Original Mortgage
$79,900
Interest Rate
7.05%
Mortgage Type
Purchase Money Mortgage
Purchase Details
Closed on
Apr 28, 2000
Sold by
Mcdowell Peter L
Bought by
Rossiter Bruce
Home Financials for this Owner
Home Financials are based on the most recent Mortgage that was taken out on this home.
Original Mortgage
$41,750
Interest Rate
8.23%
Mortgage Type
Purchase Money Mortgage
Create a Home Valuation Report for This Property
The Home Valuation Report is an in-depth analysis detailing your home's value as well as a comparison with similar homes in the area
Home Values in the Area
Average Home Value in this Area
Purchase History
| Date | Buyer | Sale Price | Title Company |
|---|---|---|---|
| Franco Lee V | $126,500 | -- | |
| Franco Lee V | $126,500 | -- | |
| Segal Deborah W | $99,900 | -- | |
| Segal Deborah W | $99,900 | -- | |
| Rossiter Bruce | $120,000 | -- | |
| Rossiter Bruce | $120,000 | -- |
Source: Public Records
Mortgage History
| Date | Status | Borrower | Loan Amount |
|---|---|---|---|
| Open | Rossiter Bruce | $165,600 | |
| Closed | Franco Lee V | $113,850 | |
| Previous Owner | Segal Deborah W | $79,900 | |
| Previous Owner | Rossiter Bruce | $41,750 |
Source: Public Records
Tax History Compared to Growth
Tax History
| Year | Tax Paid | Tax Assessment Tax Assessment Total Assessment is a certain percentage of the fair market value that is determined by local assessors to be the total taxable value of land and additions on the property. | Land | Improvement |
|---|---|---|---|---|
| 2025 | $1,557 | $359,600 | $0 | $359,600 |
| 2024 | $1,476 | $336,200 | $0 | $336,200 |
| 2023 | $1,287 | $275,600 | $0 | $275,600 |
| 2022 | $1,245 | $222,400 | $0 | $222,400 |
| 2021 | $1,312 | $217,600 | $0 | $217,600 |
| 2020 | $1,289 | $211,300 | $0 | $211,300 |
| 2019 | $1,255 | $203,400 | $0 | $203,400 |
| 2018 | $1,217 | $191,900 | $0 | $191,900 |
| 2017 | $1,413 | $229,800 | $0 | $229,800 |
| 2016 | $959 | $146,900 | $0 | $146,900 |
| 2015 | $940 | $146,900 | $0 | $146,900 |
| 2014 | $933 | $146,900 | $0 | $146,900 |
Source: Public Records
Map
Nearby Homes
- 120 Old Wharf Rd Unit 11
- 112 Old Wharf Rd Unit E4
- 112 Old Wharf Rd Unit E1
- 154 Old Wharf Rd Unit 26
- 154 Old Wharf Rd Unit 14
- 64 Beaten Rd
- 37 Ocean Dr Unit 2
- 217 Old Wharf Rd Unit 64
- 241 Old Wharf Rd Unit 82
- 241 Old Wharf Rd Unit 127
- 241 Old Wharf Rd Unit 90
- 262 Old Wharf Rd Unit 67
- 262 Old Wharf Rd Unit 5
- 262 Old Wharf Rd Unit 5
- 262 Old Wharf Rd Unit 20
- 262 Old Wharf Rd Unit 87
- 37 Beach Hills Rd
- 37-A Beach Hills Rd
- 6 Baker Way
- 80 Michaels Ave
- 120 Old Wharf Rd Unit 12
- 120 Old Wharf Rd Unit 10
- 120 Old Wharf Rd Unit 9
- 120 Old Wharf Rd Unit 8
- 120 Old Wharf Rd Unit 7
- 120 Old Wharf Rd Unit 6
- 120 Old Wharf Rd Unit 5
- 120 Old Wharf Rd Unit 4
- 120 Old Wharf Rd Unit 3
- 120 Old Wharf Rd Unit 2
- 120 Old Wharf Rd Unit 14
- 120 Old Wharf Rd
- 99 Uncle Rolf Rd Unit 14
- 99 Uncle Rolf Rd
- 14 Uncle Rolf Rd
- 123 Old Wharf Rd Unit 9
- 123 Old Wharf Rd Unit 9
- 123 Old Wharf Rd Unit 11
- 97 Uncle Rolf Rd
- 94 Bain Rd