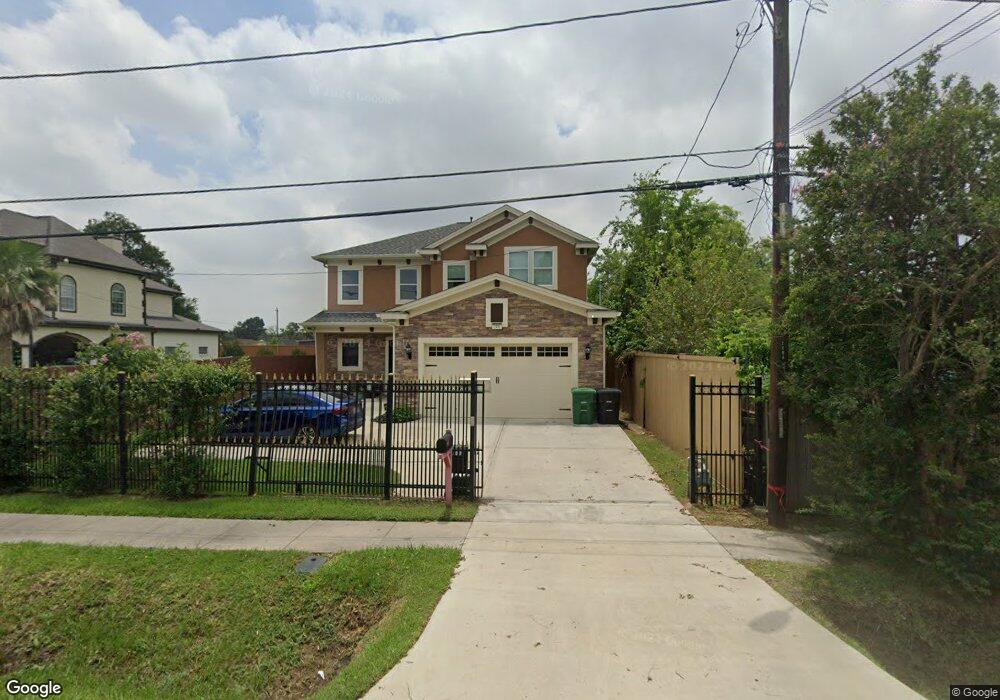
120 Palmyra St Houston, TX 77022
Northside-Northline NeighborhoodEstimated Value: $523,000 - $1,282,000
6
Beds
6
Baths
7,657
Sq Ft
$122/Sq Ft
Est. Value
About This Home
This home is located at 120 Palmyra St, Houston, TX 77022 and is currently estimated at $936,485, approximately $122 per square foot. 120 Palmyra St is a home located in Harris County with nearby schools including Janowski Elementary School, Burbank Middle School, and Sam Houston Math, Science & Technology Center.
Ownership History
Date
Name
Owned For
Owner Type
Purchase Details
Closed on
Sep 19, 2023
Sold by
Rodriguez Justino and Rodriguez Maria
Bought by
Garza Ericon and Garza Julia
Current Estimated Value
Home Financials for this Owner
Home Financials are based on the most recent Mortgage that was taken out on this home.
Original Mortgage
$726,000
Outstanding Balance
$664,127
Interest Rate
6.34%
Mortgage Type
New Conventional
Estimated Equity
$272,358
Purchase Details
Closed on
Dec 20, 2013
Sold by
Acosta Yessica R
Bought by
Rodriguez Justino and Rodriguez Maria
Purchase Details
Closed on
Aug 16, 2013
Sold by
Rodiguez Justino and Rodiguez Maria
Bought by
Acosta Yessica Rodriguez
Purchase Details
Closed on
Jun 14, 2007
Sold by
Cole Marshall and Sheppard Roland L
Bought by
Rodriguez Justino
Create a Home Valuation Report for This Property
The Home Valuation Report is an in-depth analysis detailing your home's value as well as a comparison with similar homes in the area
Home Values in the Area
Average Home Value in this Area
Purchase History
| Date | Buyer | Sale Price | Title Company |
|---|---|---|---|
| Garza Ericon | -- | Chicago Title | |
| Rodriguez Justino | -- | None Available | |
| Acosta Yessica Rodriguez | -- | None Available | |
| Rodriguez Justino | -- | First American Title |
Source: Public Records
Mortgage History
| Date | Status | Borrower | Loan Amount |
|---|---|---|---|
| Open | Garza Ericon | $726,000 |
Source: Public Records
Tax History Compared to Growth
Tax History
| Year | Tax Paid | Tax Assessment Tax Assessment Total Assessment is a certain percentage of the fair market value that is determined by local assessors to be the total taxable value of land and additions on the property. | Land | Improvement |
|---|---|---|---|---|
| 2025 | $20,296 | $1,230,000 | $208,392 | $1,021,608 |
| 2024 | $20,296 | $970,000 | $191,255 | $778,745 |
| 2023 | $20,296 | $1,651,842 | $116,535 | $1,535,307 |
| 2022 | $25,878 | $1,343,618 | $116,535 | $1,227,083 |
| 2021 | $24,901 | $1,408,230 | $116,535 | $1,291,695 |
| 2020 | $23,521 | $1,253,325 | $116,535 | $1,136,790 |
| 2019 | $29,256 | $1,156,177 | $95,970 | $1,060,207 |
| 2018 | $20,312 | $802,717 | $80,204 | $722,513 |
| 2017 | $20,297 | $802,717 | $80,204 | $722,513 |
| 2016 | $15,241 | $602,772 | $75,405 | $527,367 |
| 2015 | -- | $481,040 | $54,840 | $426,200 |
| 2014 | -- | $0 | $0 | $0 |
Source: Public Records
Map
Nearby Homes
- 210 Van Molan St
- 0 Yorkshire St Unit 17401015
- 715 E 34th St
- 0 E 31st St Unit 75519178
- 0 W Hardy St Unit 97848877
- 0 W Hardy St Unit 80694202
- 3111 Eastman St
- 245 Palmyra St
- 120 Rebecca St
- 212A Garrotsville St
- 212B Garrotsville St
- 246 Rebecca St
- 119 Rebecca St
- 131 Rebecca St
- 121-123 Van Molan St
- 136 Theron St
- 65 Neyland St
- 243 Rebecca St Unit E
- 243 Rebecca St Unit F
- 241 Rebecca St Unit A
- 120 Palmyra St
- 116 Palmyra St
- 124 Palmyra St
- 117 Van Molan St
- 119 Palmyra St
- 123 Palmyra St
- 115 Palmyra St
- 204 Palmyra St
- 125 Palmyra St
- 201 Palmyra St
- 125 Van Molan St
- 205 Palmyra St
- 133 Van Molan St
- 208 Palmyra St
- 7520 Fulton St
- 207 Palmyra St
- 137 Van Molan St
- 112 Garrotsville St
- 108 Van Molan St
- 120 Garrotsville St