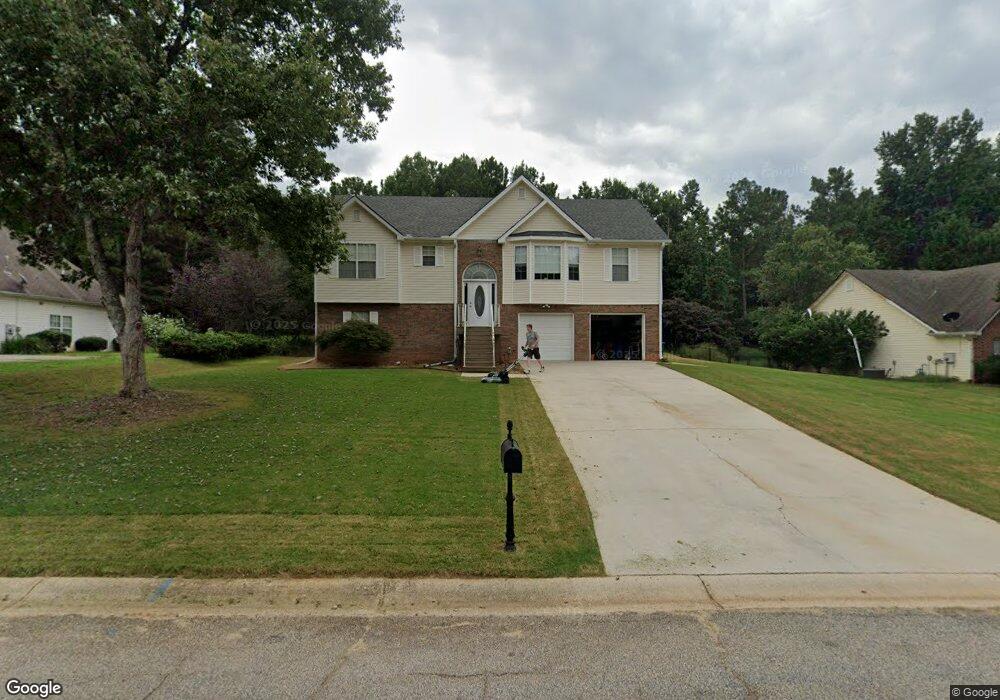
120 Pebble Brooke Pass Unit 3 Covington, GA 30016
Estimated Value: $269,222 - $293,000
--
Bed
2
Baths
1,522
Sq Ft
$185/Sq Ft
Est. Value
About This Home
This home is located at 120 Pebble Brooke Pass Unit 3, Covington, GA 30016 and is currently estimated at $282,306, approximately $185 per square foot. 120 Pebble Brooke Pass Unit 3 is a home located in Newton County with nearby schools including West Newton Elementary School, Liberty Middle School, and Newton High School.
Ownership History
Date
Name
Owned For
Owner Type
Purchase Details
Closed on
Dec 1, 2022
Sold by
Bowman Ray A
Bought by
Bowman Ray A and Bowman Samantha Rae
Current Estimated Value
Purchase Details
Closed on
Mar 28, 2003
Sold by
Castle Grp Hms Inc
Bought by
Rashada Deborah
Home Financials for this Owner
Home Financials are based on the most recent Mortgage that was taken out on this home.
Original Mortgage
$158,900
Interest Rate
5.82%
Mortgage Type
New Conventional
Purchase Details
Closed on
Mar 1, 2000
Sold by
Anderson Home Builders Inc
Bought by
Bowman Ray A and Bowman Penny S
Home Financials for this Owner
Home Financials are based on the most recent Mortgage that was taken out on this home.
Original Mortgage
$124,744
Interest Rate
8.29%
Mortgage Type
FHA
Create a Home Valuation Report for This Property
The Home Valuation Report is an in-depth analysis detailing your home's value as well as a comparison with similar homes in the area
Home Values in the Area
Average Home Value in this Area
Purchase History
| Date | Buyer | Sale Price | Title Company |
|---|---|---|---|
| Bowman Ray A | -- | -- | |
| Rashada Deborah | $158,900 | -- | |
| Bowman Ray A | $124,900 | -- |
Source: Public Records
Mortgage History
| Date | Status | Borrower | Loan Amount |
|---|---|---|---|
| Previous Owner | Rashada Deborah | $158,900 | |
| Previous Owner | Bowman Ray A | $124,744 |
Source: Public Records
Tax History Compared to Growth
Tax History
| Year | Tax Paid | Tax Assessment Tax Assessment Total Assessment is a certain percentage of the fair market value that is determined by local assessors to be the total taxable value of land and additions on the property. | Land | Improvement |
|---|---|---|---|---|
| 2024 | $2,788 | $111,640 | $16,000 | $95,640 |
| 2023 | $3,193 | $119,440 | $7,600 | $111,840 |
| 2022 | $2,081 | $78,440 | $7,600 | $70,840 |
| 2021 | $2,100 | $71,240 | $7,600 | $63,640 |
| 2020 | $2,253 | $69,280 | $7,600 | $61,680 |
| 2019 | $2,074 | $63,040 | $7,600 | $55,440 |
| 2018 | $1,785 | $54,240 | $7,600 | $46,640 |
| 2017 | $1,667 | $50,800 | $7,600 | $43,200 |
| 2016 | $1,469 | $45,040 | $4,000 | $41,040 |
| 2015 | $1,405 | $43,680 | $4,000 | $39,680 |
| 2014 | $1,161 | $36,640 | $0 | $0 |
Source: Public Records
Map
Nearby Homes
- 100 Pebble Brooke Pass
- 130 Pebble Brooke Pass
- 0 Pebble Brooke Pass Unit 8140603
- 0 Pebble Brooke Pass Unit 8937105
- 0 Pebble Brooke Pass Unit 7426280
- 0 Pebble Brooke Pass
- 110 Pebble Way
- 125 Pebble Brooke Pass
- 90 Pebble Brooke Pass
- 100 Pebble Way
- 105 Pebble Brooke Pass
- 140 Pebble Brooke Pass
- 40 Pebble Way
- 115 Pebble Brooke Pass
- 95 Pebble Brooke Pass
- 120 Pebble Way
- 80 Pebble Brooke Pass
- 90 Pebble Way
- 135 Pebble Brooke Pass
- 115 Pebble Way