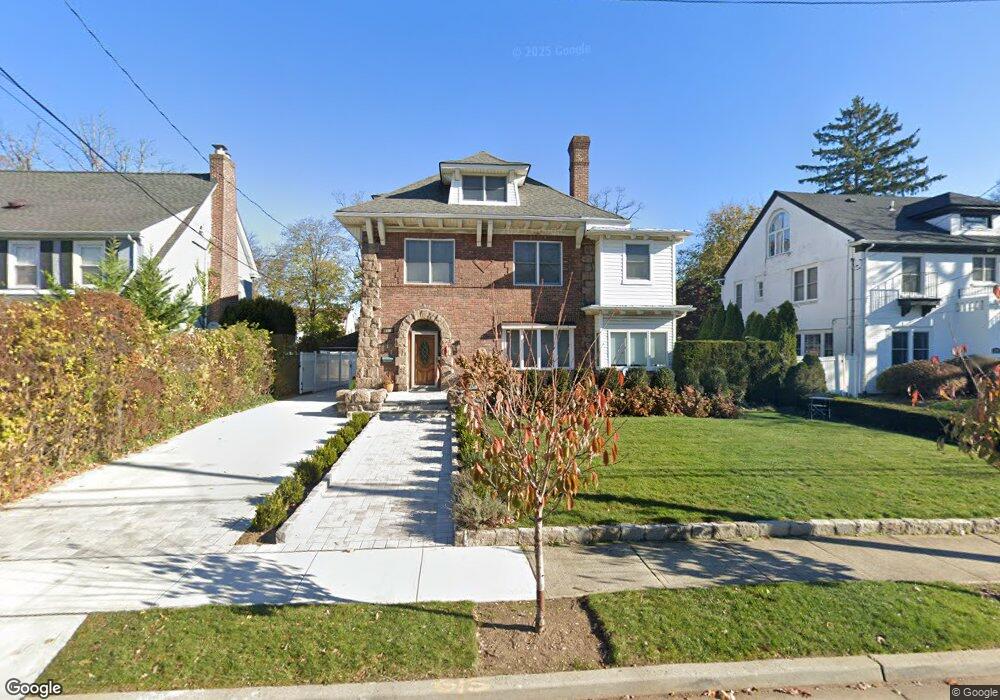
120 Pine St Woodmere, NY 11598
Estimated Value: $1,892,971 - $2,621,000
Studio
5
Baths
3,173
Sq Ft
$711/Sq Ft
Est. Value
About This Home
This home is located at 120 Pine St, Woodmere, NY 11598 and is currently estimated at $2,256,986, approximately $711 per square foot. 120 Pine St is a home located in Nassau County with nearby schools including Lawrence Elementary School, Lawrence Primary School, and Lawrence Middle School.
Ownership History
Date
Name
Owned For
Owner Type
Purchase Details
Closed on
Aug 31, 2016
Sold by
Hackel Eric and Hackel Celeste
Bought by
Kalaie Moshe and Kalaie Dalit Rebecca
Current Estimated Value
Home Financials for this Owner
Home Financials are based on the most recent Mortgage that was taken out on this home.
Original Mortgage
$1,043,000
Outstanding Balance
$824,708
Interest Rate
3.12%
Mortgage Type
Adjustable Rate Mortgage/ARM
Estimated Equity
$1,432,278
Purchase Details
Closed on
Aug 29, 2006
Sold by
Minsky Lisa
Bought by
Hackel Eric
Purchase Details
Closed on
Jul 8, 2003
Sold by
Damti Avinoam
Purchase Details
Closed on
Sep 15, 1995
Sold by
Granite Management Corp
Bought by
Damti Avinoam and Minsky Lisa
Home Financials for this Owner
Home Financials are based on the most recent Mortgage that was taken out on this home.
Original Mortgage
$163,500
Interest Rate
7.89%
Purchase Details
Closed on
Dec 21, 1994
Sold by
Vitacco Guy Jr Ref
Bought by
Granite Management Corp
Create a Home Valuation Report for This Property
The Home Valuation Report is an in-depth analysis detailing your home's value as well as a comparison with similar homes in the area
Home Values in the Area
Average Home Value in this Area
Purchase History
| Date | Buyer | Sale Price | Title Company |
|---|---|---|---|
| Kalaie Moshe | $1,490,000 | Judicial Title | |
| Hackel Eric | $962,750 | -- | |
| -- | -- | -- | |
| Damti Avinoam | $218,000 | -- | |
| Granite Management Corp | $310,127 | -- |
Source: Public Records
Mortgage History
| Date | Status | Borrower | Loan Amount |
|---|---|---|---|
| Open | Kalaie Moshe | $1,043,000 | |
| Previous Owner | Damti Avinoam | $163,500 |
Source: Public Records
Tax History
| Year | Tax Paid | Tax Assessment Tax Assessment Total Assessment is a certain percentage of the fair market value that is determined by local assessors to be the total taxable value of land and additions on the property. | Land | Improvement |
|---|---|---|---|---|
| 2025 | $17,080 | $1,002 | $376 | $626 |
| 2024 | $7,600 | $1,053 | $395 | $658 |
Source: Public Records
Map
Nearby Homes
- 136 Linden St
- 132 Park St
- 761 W Broadway
- 219 Pearsall Place
- 770 W Broadway
- 1 Meadow Dr Unit 1K
- 1 Meadow Dr Unit 3H-2
- 1 Meadow Dr Unit 3D
- 219 Narrow Ln
- 141 Wyckoff Place Unit 6-E
- 141 Wyckoff Place Unit 1F
- 141 Wyckoff Place Unit 2E
- 141 Woodmere Blvd Unit 6E
- 141 Woodmere Blvd Unit 5C
- 141 Woodmere Blvd Unit 6-C
- 313 Forest Ave
- 876 Woodmere Place
- 22 Willow Rd
- 17 Burton Ave
- 943 Central Ave