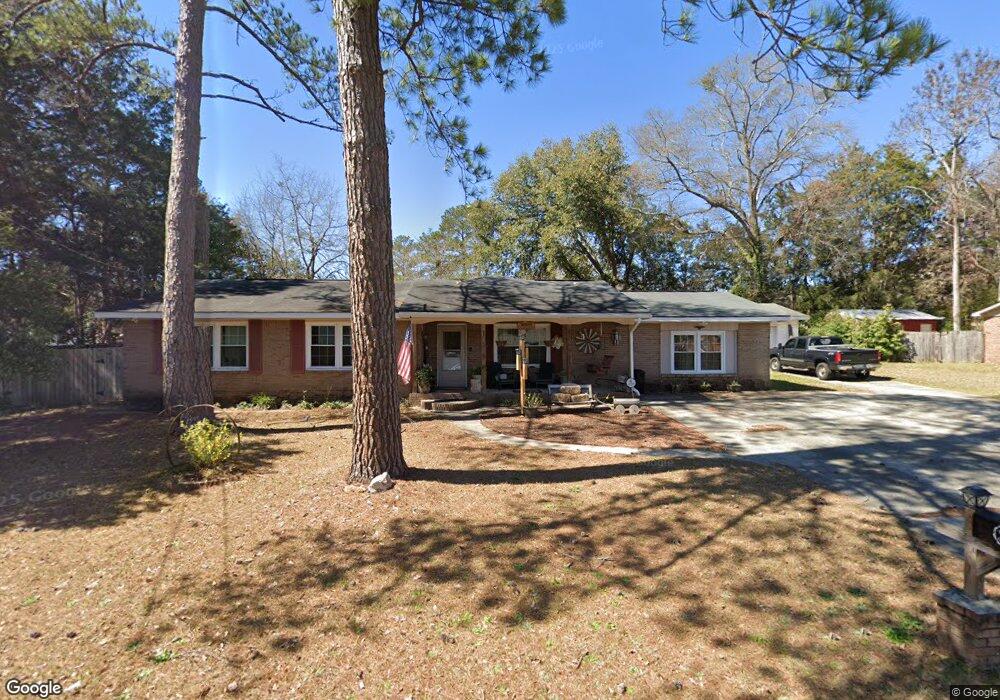
120 Redwood Dr Warner Robins, GA 31088
Estimated Value: $218,000 - $246,045
4
Beds
3
Baths
2,299
Sq Ft
$101/Sq Ft
Est. Value
About This Home
This home is located at 120 Redwood Dr, Warner Robins, GA 31088 and is currently estimated at $233,011, approximately $101 per square foot. 120 Redwood Dr is a home located in Houston County with nearby schools including Miller Elementary School, Warner Robins Middle School, and Warner Robins High School.
Ownership History
Date
Name
Owned For
Owner Type
Purchase Details
Closed on
Oct 31, 2007
Sold by
Mackey William L and Mackey Toni F
Bought by
Beasley John C
Current Estimated Value
Home Financials for this Owner
Home Financials are based on the most recent Mortgage that was taken out on this home.
Original Mortgage
$132,795
Outstanding Balance
$83,542
Interest Rate
6.27%
Mortgage Type
VA
Estimated Equity
$149,469
Purchase Details
Closed on
Mar 30, 1998
Sold by
Smith Thomas R
Bought by
Mackey William L and Toni F*
Purchase Details
Closed on
Apr 13, 1977
Sold by
Hunnicutt Jackie C
Bought by
Smith Thomas R
Purchase Details
Closed on
Dec 2, 1976
Sold by
Johnson Zane and Johnson Rose L
Bought by
Hunnicutt Jackie C
Purchase Details
Closed on
Jul 1, 1974
Sold by
Dunn Beverly S
Bought by
Johnson Zane and Johnson Rose L
Purchase Details
Closed on
Apr 1, 1972
Sold by
Scott W C
Bought by
Dunn Beverly S
Create a Home Valuation Report for This Property
The Home Valuation Report is an in-depth analysis detailing your home's value as well as a comparison with similar homes in the area
Home Values in the Area
Average Home Value in this Area
Purchase History
| Date | Buyer | Sale Price | Title Company |
|---|---|---|---|
| Beasley John C | $130,000 | None Available | |
| Mackey William L | $81,000 | -- | |
| Smith Thomas R | -- | -- | |
| Hunnicutt Jackie C | -- | -- | |
| Johnson Zane | -- | -- | |
| Dunn Beverly S | -- | -- |
Source: Public Records
Mortgage History
| Date | Status | Borrower | Loan Amount |
|---|---|---|---|
| Open | Beasley John C | $132,795 |
Source: Public Records
Tax History Compared to Growth
Tax History
| Year | Tax Paid | Tax Assessment Tax Assessment Total Assessment is a certain percentage of the fair market value that is determined by local assessors to be the total taxable value of land and additions on the property. | Land | Improvement |
|---|---|---|---|---|
| 2024 | -- | $78,920 | $5,000 | $73,920 |
| 2023 | $0 | $63,840 | $5,000 | $58,840 |
| 2022 | $1,667 | $50,560 | $5,400 | $45,160 |
| 2021 | $1,444 | $43,400 | $5,400 | $38,000 |
| 2020 | $1,424 | $42,800 | $5,400 | $37,400 |
| 2019 | $994 | $42,800 | $5,400 | $37,400 |
| 2018 | $994 | $42,800 | $5,400 | $37,400 |
| 2017 | $995 | $42,800 | $5,400 | $37,400 |
| 2016 | $997 | $42,800 | $5,400 | $37,400 |
| 2015 | -- | $42,800 | $5,400 | $37,400 |
| 2014 | -- | $42,800 | $5,400 | $37,400 |
| 2013 | -- | $42,800 | $5,400 | $37,400 |
Source: Public Records
Map
Nearby Homes
- 118 Redwood Dr
- 300 Kirkwood Cir
- 124 Redwood Dr
- 116 Redwood Dr
- 121 Redwood Dr
- 104 Ivey Way
- 302 Kirkwood Cir
- 0 Redwood Dr Unit 8241979
- 0 Redwood Dr
- 119 Redwood Dr
- 123 Redwood Dr
- 117 Redwood Dr
- 114 Redwood Dr
- 102 Ivey Way
- 304 Kirkwood Cir
- 115 Redwood Dr
- 105 Ivey Way
- 112 Redwood Dr
- 200 Kirkwood Cir
- 136 Kirkwood Cir