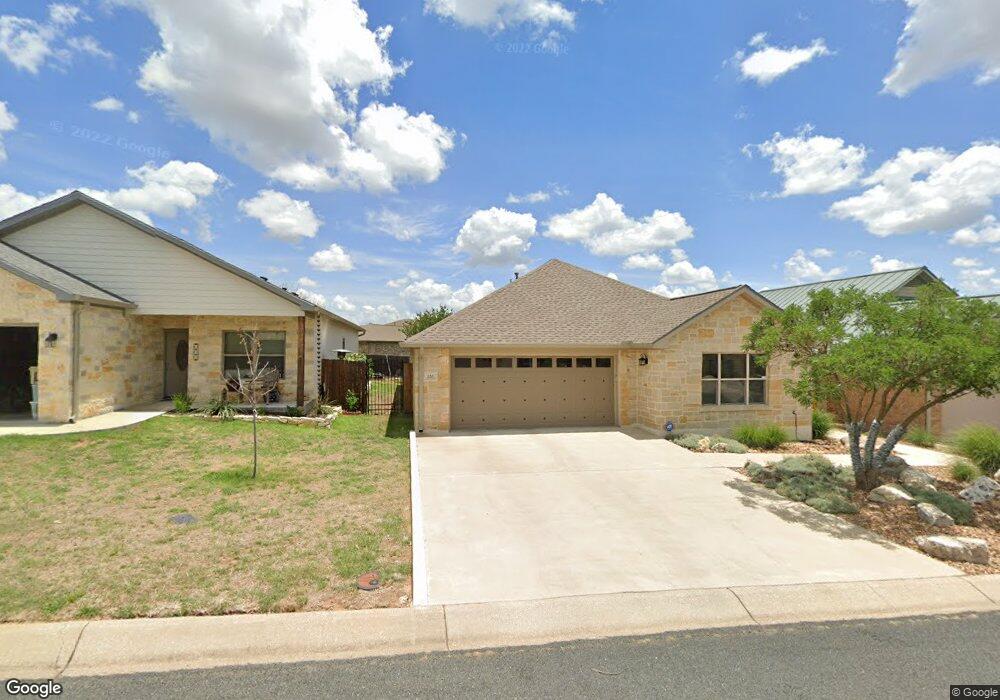
120 Riley Ln Fredericksburg, TX 78624
Estimated Value: $384,144 - $474,000
--
Bed
--
Bath
1,657
Sq Ft
$258/Sq Ft
Est. Value
About This Home
This home is located at 120 Riley Ln, Fredericksburg, TX 78624 and is currently estimated at $428,036, approximately $258 per square foot. 120 Riley Ln is a home located in Gillespie County with nearby schools including Fredericksburg High School, Ambleside School of Fredericksburg, and St. Mary's Catholic School.
Ownership History
Date
Name
Owned For
Owner Type
Purchase Details
Closed on
Aug 27, 2007
Sold by
Dartez Bros Construction Inc
Bought by
Hibler Larry D and Hibler Glenda S
Current Estimated Value
Home Financials for this Owner
Home Financials are based on the most recent Mortgage that was taken out on this home.
Original Mortgage
$185,500
Outstanding Balance
$117,809
Interest Rate
6.72%
Mortgage Type
New Conventional
Estimated Equity
$310,227
Create a Home Valuation Report for This Property
The Home Valuation Report is an in-depth analysis detailing your home's value as well as a comparison with similar homes in the area
Home Values in the Area
Average Home Value in this Area
Purchase History
| Date | Buyer | Sale Price | Title Company |
|---|---|---|---|
| Hibler Larry D | -- | None Available |
Source: Public Records
Mortgage History
| Date | Status | Borrower | Loan Amount |
|---|---|---|---|
| Open | Hibler Larry D | $185,500 |
Source: Public Records
Tax History Compared to Growth
Tax History
| Year | Tax Paid | Tax Assessment Tax Assessment Total Assessment is a certain percentage of the fair market value that is determined by local assessors to be the total taxable value of land and additions on the property. | Land | Improvement |
|---|---|---|---|---|
| 2025 | $5,748 | $459,130 | $83,880 | $375,250 |
| 2024 | $5,748 | $425,379 | $64,190 | $383,080 |
| 2023 | $4,737 | $386,708 | $64,190 | $383,080 |
| 2022 | $5,254 | $389,580 | $57,500 | $332,080 |
| 2021 | $5,391 | $340,880 | $52,500 | $288,380 |
| 2020 | $5,004 | $290,540 | $50,000 | $240,540 |
| 2019 | $5,143 | $287,840 | $50,000 | $237,840 |
| 2018 | $4,761 | $267,610 | $50,000 | $217,610 |
| 2017 | $4,785 | $261,720 | $50,000 | $211,720 |
| 2016 | $4,606 | $251,940 | $50,000 | $201,940 |
| 2015 | -- | $249,810 | $38,000 | $211,810 |
| 2014 | -- | $223,880 | $32,000 | $191,880 |
Source: Public Records
Map
Nearby Homes
- 204 Morning Glory Dr
- 216 Riley Ln
- 205 Edgewood Dr
- 1603 Redwood Ct
- 222 Dudley Way
- 1602 Redwood Ct
- 1604 Redwood Ct
- 227 Dudley Way
- 227 Riley Ln
- 107 W Driftwood Dr
- 224 W Lower Crabapple Rd
- 205 Crestwood Dr
- 303 Winston Dr
- 217 W Driftwood Dr
- 203 Broadmoor Dr
- 124 Frederick Rd
- 2009 Woodway Ct
- 2009 Woodway Ct Unit 41
- 1709 N Llano St
- 1826 Quailwood Dr
- 122 Riley Ln Unit 24
- 122 Riley Ln
- 1706 Cherrywood Dr
- 1718 Cherrywood Dr Unit 34
- 118 Riley Ln
- 118 Riley Ln Unit 1
- 1702 Cherrywood Dr
- 1708 Cherrywood Dr
- 113 Riley Ln
- 1710 Cherrywood Dr
- 115 Riley Ln
- 115 Riley Ln Unit 1
- 1707 Cherrywood Dr Unit 16
- 1707 Cherrywood Dr
- 1709 Cherrywood Dr
- 1705 Cherrywood Dr Unit 17
- 1705 Cherrywood Dr
- 119 Riley Ln
- 202 Riley Ln Unit 63
- 202 Riley Ln