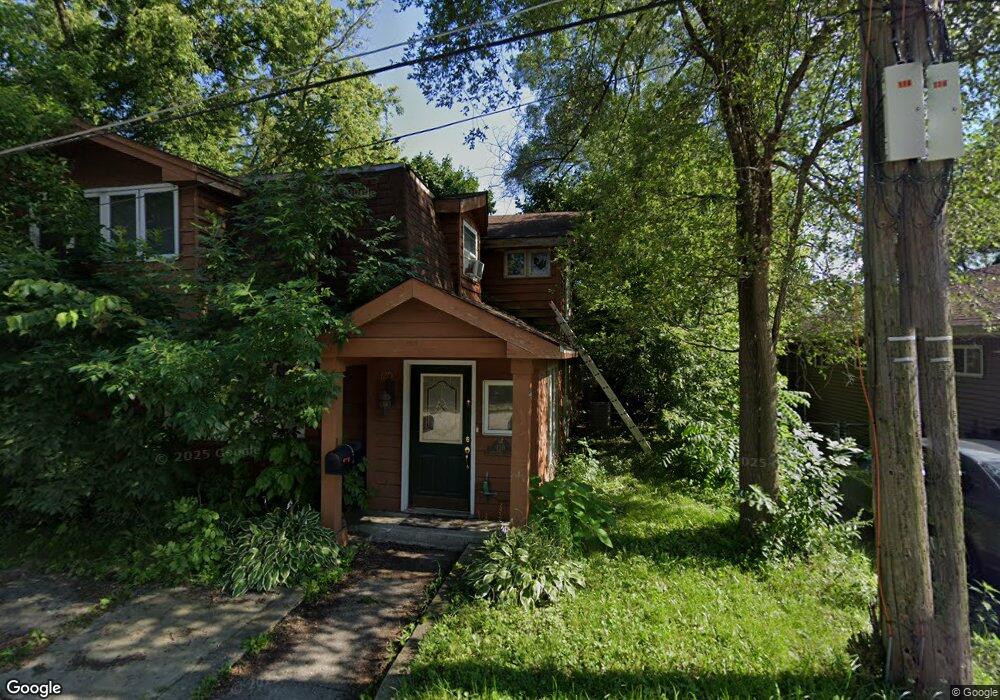
120 Roosevelt Rd Wauconda, IL 60084
Estimated Value: $342,320 - $395,000
3
Beds
1
Bath
2,508
Sq Ft
$147/Sq Ft
Est. Value
About This Home
This home is located at 120 Roosevelt Rd, Wauconda, IL 60084 and is currently estimated at $369,080, approximately $147 per square foot. 120 Roosevelt Rd is a home located in Lake County with nearby schools including Wauconda Grade School, Wauconda Middle School, and Wauconda High School.
Ownership History
Date
Name
Owned For
Owner Type
Purchase Details
Closed on
Sep 26, 2006
Sold by
Mcgrath Kenneth and Mc Grath Mary
Bought by
Arnold James and Arnold Victoria
Current Estimated Value
Home Financials for this Owner
Home Financials are based on the most recent Mortgage that was taken out on this home.
Original Mortgage
$215,910
Outstanding Balance
$147,445
Interest Rate
9.25%
Mortgage Type
Purchase Money Mortgage
Estimated Equity
$221,635
Purchase Details
Closed on
Apr 1, 2005
Sold by
Toomey George R and Toomey Karla
Bought by
Mcgrath Kenneth and Mcgrath Mary
Home Financials for this Owner
Home Financials are based on the most recent Mortgage that was taken out on this home.
Original Mortgage
$170,396
Interest Rate
5.89%
Mortgage Type
New Conventional
Purchase Details
Closed on
Oct 1, 2004
Sold by
Hamburg Jerry G and Hamburg Bernadine C
Bought by
Toomey George R and Toomey Karla
Create a Home Valuation Report for This Property
The Home Valuation Report is an in-depth analysis detailing your home's value as well as a comparison with similar homes in the area
Home Values in the Area
Average Home Value in this Area
Purchase History
| Date | Buyer | Sale Price | Title Company |
|---|---|---|---|
| Arnold James | $240,000 | None Available | |
| Mcgrath Kenneth | $213,000 | Chicago Title Insurance Comp | |
| Toomey George R | -- | -- |
Source: Public Records
Mortgage History
| Date | Status | Borrower | Loan Amount |
|---|---|---|---|
| Open | Arnold James | $215,910 | |
| Previous Owner | Mcgrath Kenneth | $170,396 | |
| Closed | Mcgrath Kenneth | $21,299 |
Source: Public Records
Tax History Compared to Growth
Tax History
| Year | Tax Paid | Tax Assessment Tax Assessment Total Assessment is a certain percentage of the fair market value that is determined by local assessors to be the total taxable value of land and additions on the property. | Land | Improvement |
|---|---|---|---|---|
| 2024 | $6,744 | $83,843 | $12,741 | $71,102 |
| 2023 | $7,425 | $76,639 | $11,646 | $64,993 |
| 2022 | $7,425 | $74,051 | $7,892 | $66,159 |
| 2021 | $7,081 | $69,971 | $7,457 | $62,514 |
| 2020 | $6,848 | $66,690 | $7,107 | $59,583 |
| 2019 | $6,077 | $63,028 | $6,717 | $56,311 |
| 2018 | $6,601 | $63,417 | $7,808 | $55,609 |
| 2017 | $6,594 | $62,684 | $7,718 | $54,966 |
| 2016 | $6,184 | $59,360 | $7,309 | $52,051 |
| 2015 | $5,799 | $54,494 | $6,710 | $47,784 |
| 2014 | $4,654 | $46,181 | $7,857 | $38,324 |
| 2012 | $4,553 | $45,863 | $7,517 | $38,346 |
Source: Public Records
Map
Nearby Homes
- 450 N Main St Unit S307A
- 450 N Main St Unit S208A
- 136 Hubbard Ct
- 125 E Mill St Unit D103
- 131 E Mill St Unit B104
- 146 E Mill St
- 311 Brown St
- 318 E Liberty St
- 136 Parkview Dr Unit 5136
- 240 Regency Ct
- 225 Regency Ct Unit A
- 28177 N Garland Rd
- 107 Hammond Ave
- 300 Barrington Rd
- 26049 N Il Route 59
- 235 Regency Ct Unit B
- 325 Sundown Ct Unit B
- 25721 W Lakeview Ave
- 25586 W High St
- 25578 W High St
- 124 Roosevelt Rd
- 116 Roosevelt Rd
- 114 Roosevelt Ave
- 114 Roosevelt Rd
- 121 Roosevelt Ave
- 121 Roosevelt Rd
- 125 Roosevelt Rd
- 418 Morning Star Ln
- 117 Roosevelt Rd
- 130 Roosevelt Ave
- 113 Roosevelt Ave
- 113 Roosevelt Rd
- 416 Morning Star Ln
- 406 Morning Star Ln
- 108 Roosevelt Ave
- 108 Roosevelt Ave
- 404 N Main St
- 404 N Main St
- 404B N Main St
- 404A N Main St