Estimated Value: $128,000 - $163,000
3
Beds
2
Baths
1,060
Sq Ft
$132/Sq Ft
Est. Value
About This Home
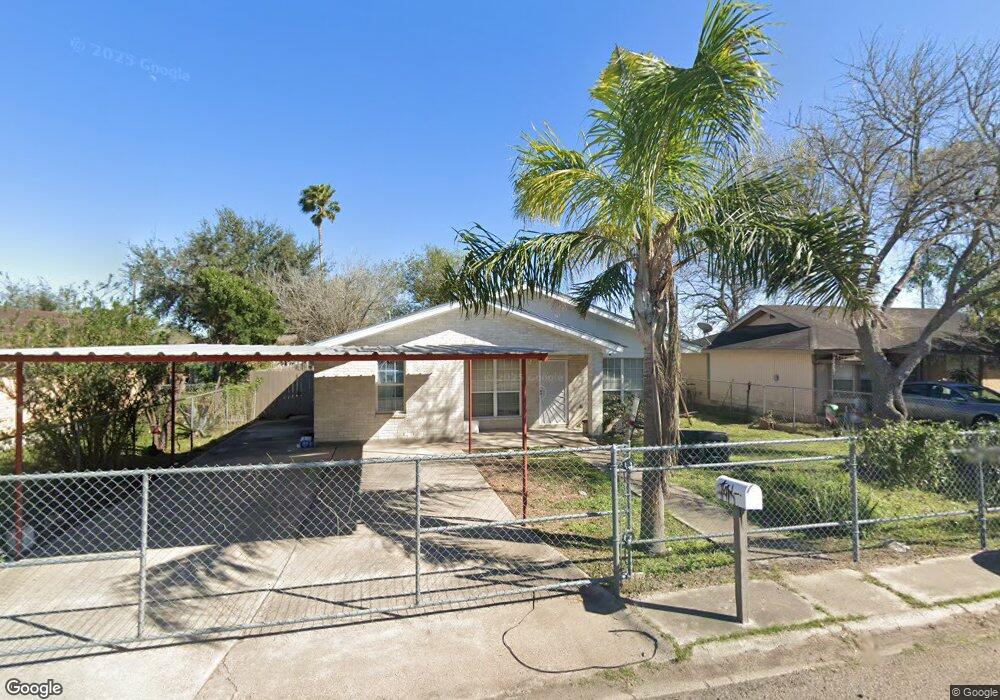
This home is located at 120 S 2nd St, Donna, TX 78537 and is currently estimated at $140,126, approximately $132 per square foot. 120 S 2nd St is a home located in Hidalgo County with nearby schools including A.M. Ochoa Elementary School, A.P. Solis Middle School, and Donna High School.
Ownership History
Date
Name
Owned For
Owner Type
Purchase Details
Closed on
Jul 30, 2007
Sold by
J J Construction
Bought by
Tovar Jesus R
Current Estimated Value
Home Financials for this Owner
Home Financials are based on the most recent Mortgage that was taken out on this home.
Original Mortgage
$55,318
Interest Rate
6.73%
Mortgage Type
Purchase Money Mortgage
Purchase Details
Closed on
Feb 6, 2007
Sold by
Barragan Jose A and Barragan Rosalinda
Bought by
J J Construction
Create a Home Valuation Report for This Property
The Home Valuation Report is an in-depth analysis detailing your home's value as well as a comparison with similar homes in the area
Home Values in the Area
Average Home Value in this Area
Purchase History
| Date | Buyer | Sale Price | Title Company |
|---|---|---|---|
| Tovar Jesus R | -- | Southern Star Title Co | |
| J J Construction | $28,000 | None Available |
Source: Public Records
Mortgage History
| Date | Status | Borrower | Loan Amount |
|---|---|---|---|
| Closed | Tovar Jesus R | $55,318 |
Source: Public Records
Tax History Compared to Growth
Tax History
| Year | Tax Paid | Tax Assessment Tax Assessment Total Assessment is a certain percentage of the fair market value that is determined by local assessors to be the total taxable value of land and additions on the property. | Land | Improvement |
|---|---|---|---|---|
| 2025 | $836 | $102,607 | -- | -- |
| 2024 | $836 | $93,279 | $24,161 | $69,118 |
| 2023 | $2,482 | $94,343 | $24,161 | $70,182 |
| 2022 | $1,770 | $63,848 | $0 | $0 |
| 2021 | $1,637 | $58,044 | $24,928 | $46,211 |
| 2020 | $1,540 | $52,767 | $21,860 | $35,720 |
| 2019 | $1,413 | $47,737 | $16,107 | $31,630 |
| 2018 | $1,449 | $48,831 | $16,107 | $32,724 |
| 2017 | $1,595 | $50,475 | $16,107 | $34,368 |
| 2016 | $1,547 | $48,950 | $16,107 | $32,843 |
| 2015 | $890 | $49,961 | $16,107 | $33,854 |
Source: Public Records
Map
Nearby Homes