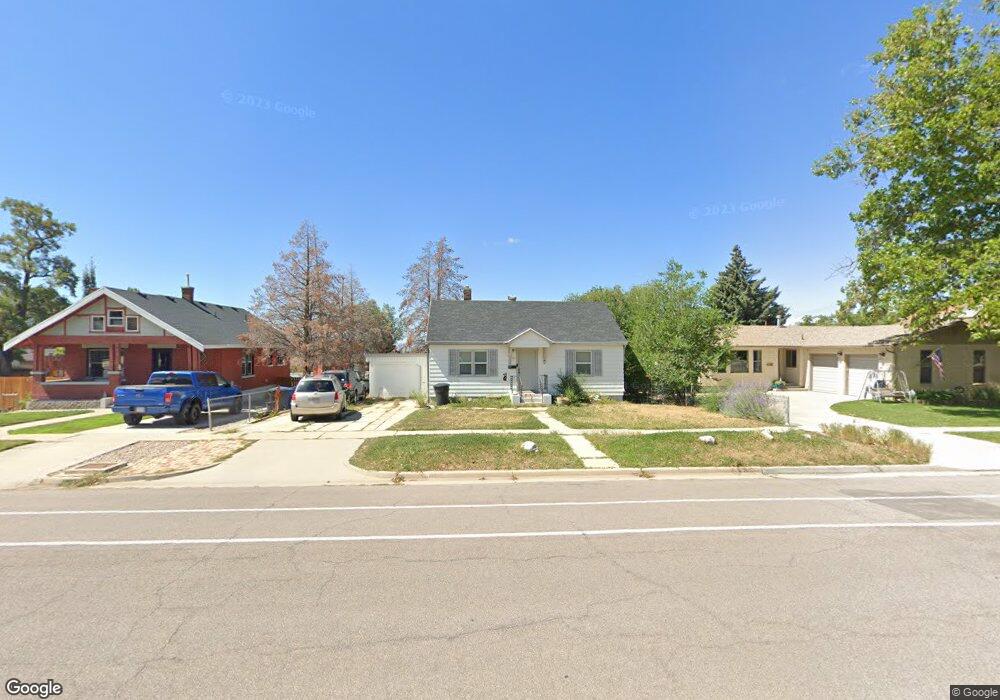
120 S 300 W Brigham City, UT 84302
Estimated Value: $313,113 - $419,000
--
Bed
--
Bath
858
Sq Ft
$420/Sq Ft
Est. Value
About This Home
This home is located at 120 S 300 W, Brigham City, UT 84302 and is currently estimated at $360,028, approximately $419 per square foot. 120 S 300 W is a home located in Box Elder County with nearby schools including Lake View Elementary School, Box Elder Middle School, and Adele C. Young Intermediate School.
Ownership History
Date
Name
Owned For
Owner Type
Purchase Details
Closed on
Apr 15, 2022
Sold by
Marci Beeton
Bought by
M Beeton Investments Llc
Current Estimated Value
Purchase Details
Closed on
Jan 22, 2022
Sold by
M Beeton Investments L Lc
Bought by
Beeton Marci
Purchase Details
Closed on
Jun 11, 2019
Sold by
Dejarnatt Rebekkah and Estate Of Sabra Gauegos
Bought by
M Beeton Invegtments Llc
Purchase Details
Closed on
Sep 15, 2015
Sold by
Dejarnatt Rebekkah L
Bought by
Gallegos Sabra L
Create a Home Valuation Report for This Property
The Home Valuation Report is an in-depth analysis detailing your home's value as well as a comparison with similar homes in the area
Home Values in the Area
Average Home Value in this Area
Purchase History
| Date | Buyer | Sale Price | Title Company |
|---|---|---|---|
| M Beeton Investments Llc | -- | Amicus Title | |
| Beeton Marci | -- | New Title Company Name | |
| M Beeton Invegtments Llc | -- | Heritage West Title Be | |
| Gallegos Sabra L | -- | None Available |
Source: Public Records
Tax History Compared to Growth
Tax History
| Year | Tax Paid | Tax Assessment Tax Assessment Total Assessment is a certain percentage of the fair market value that is determined by local assessors to be the total taxable value of land and additions on the property. | Land | Improvement |
|---|---|---|---|---|
| 2025 | $1,615 | $317,695 | $105,000 | $212,695 |
| 2024 | $1,615 | $310,996 | $100,000 | $210,996 |
| 2023 | $1,614 | $318,069 | $95,000 | $223,069 |
| 2022 | $1,625 | $297,858 | $40,000 | $257,858 |
| 2021 | $1,269 | $184,206 | $40,000 | $144,206 |
| 2020 | $1,134 | $184,206 | $40,000 | $144,206 |
| 2018 | $966 | $83,034 | $22,000 | $61,034 |
| 2017 | $872 | $129,800 | $16,500 | $99,800 |
| 2016 | $914 | $68,776 | $16,500 | $52,276 |
| 2015 | $852 | $64,024 | $16,500 | $47,524 |
| 2014 | $852 | $61,761 | $16,500 | $45,261 |
| 2013 | -- | $61,761 | $16,500 | $45,261 |
Source: Public Records
Map
Nearby Homes