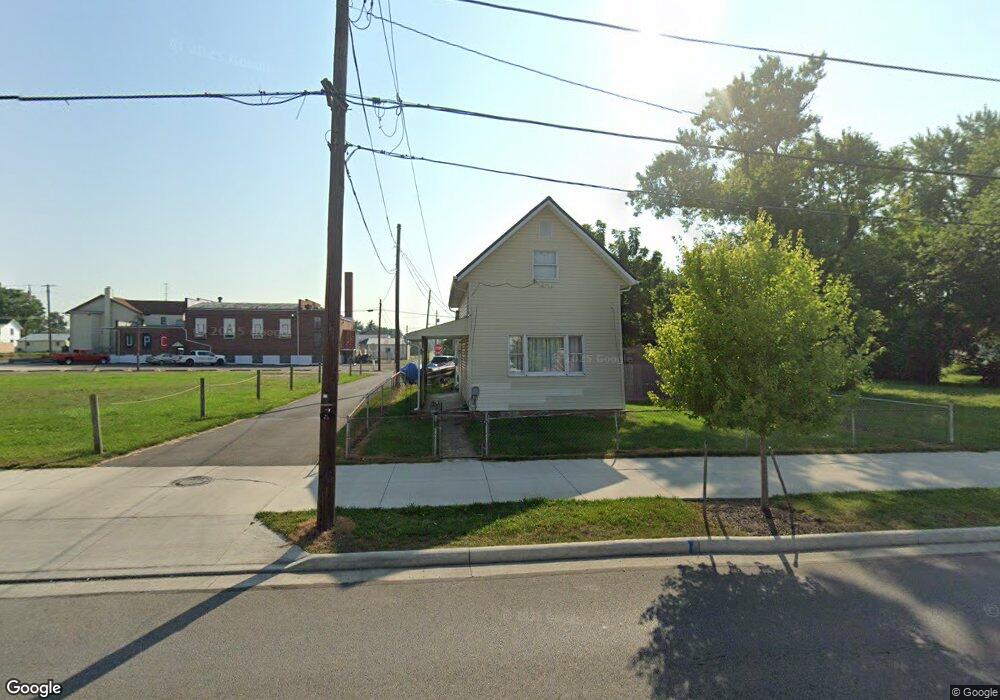
120 S 4th St Newark, OH 43055
Estimated Value: $108,000 - $139,558
2
Beds
1
Bath
998
Sq Ft
$130/Sq Ft
Est. Value
About This Home
This home is located at 120 S 4th St, Newark, OH 43055 and is currently estimated at $129,390, approximately $129 per square foot. 120 S 4th St is a home located in Licking County with nearby schools including Ben Franklin Elementary School, Heritage Middle School, and Newark High School.
Ownership History
Date
Name
Owned For
Owner Type
Purchase Details
Closed on
Dec 22, 2020
Sold by
Lowry Scott and Lowry Misty
Bought by
Lowry Family Preservation Trust and Smart
Current Estimated Value
Purchase Details
Closed on
Feb 28, 2014
Sold by
K I S Investments Ltd
Bought by
Lowry Scott and Lowry Misty
Home Financials for this Owner
Home Financials are based on the most recent Mortgage that was taken out on this home.
Original Mortgage
$22,400
Interest Rate
4.39%
Mortgage Type
Future Advance Clause Open End Mortgage
Purchase Details
Closed on
Jan 31, 2003
Sold by
Williams Keith A
Bought by
K I S Investments Ltd
Home Financials for this Owner
Home Financials are based on the most recent Mortgage that was taken out on this home.
Original Mortgage
$43,000
Interest Rate
6.13%
Mortgage Type
New Conventional
Create a Home Valuation Report for This Property
The Home Valuation Report is an in-depth analysis detailing your home's value as well as a comparison with similar homes in the area
Home Values in the Area
Average Home Value in this Area
Purchase History
| Date | Buyer | Sale Price | Title Company |
|---|---|---|---|
| Lowry Family Preservation Trust | $11,333 | None Listed On Document | |
| Lowry Scott | -- | None Available | |
| K I S Investments Ltd | $40,000 | -- |
Source: Public Records
Mortgage History
| Date | Status | Borrower | Loan Amount |
|---|---|---|---|
| Previous Owner | Lowry Scott | $22,400 | |
| Previous Owner | K I S Investments Ltd | $43,000 |
Source: Public Records
Tax History Compared to Growth
Tax History
| Year | Tax Paid | Tax Assessment Tax Assessment Total Assessment is a certain percentage of the fair market value that is determined by local assessors to be the total taxable value of land and additions on the property. | Land | Improvement |
|---|---|---|---|---|
| 2024 | $1,112 | $30,280 | $4,480 | $25,800 |
| 2023 | $1,110 | $30,280 | $4,480 | $25,800 |
| 2022 | $924 | $22,400 | $2,590 | $19,810 |
| 2021 | $970 | $22,400 | $2,590 | $19,810 |
| 2020 | $992 | $22,400 | $2,590 | $19,810 |
| 2019 | $846 | $18,380 | $1,860 | $16,520 |
| 2018 | $846 | $0 | $0 | $0 |
| 2017 | $811 | $0 | $0 | $0 |
| 2016 | $861 | $0 | $0 | $0 |
| 2015 | $880 | $0 | $0 | $0 |
| 2014 | $1,097 | $0 | $0 | $0 |
| 2013 | $837 | $0 | $0 | $0 |
Source: Public Records
Map
Nearby Homes