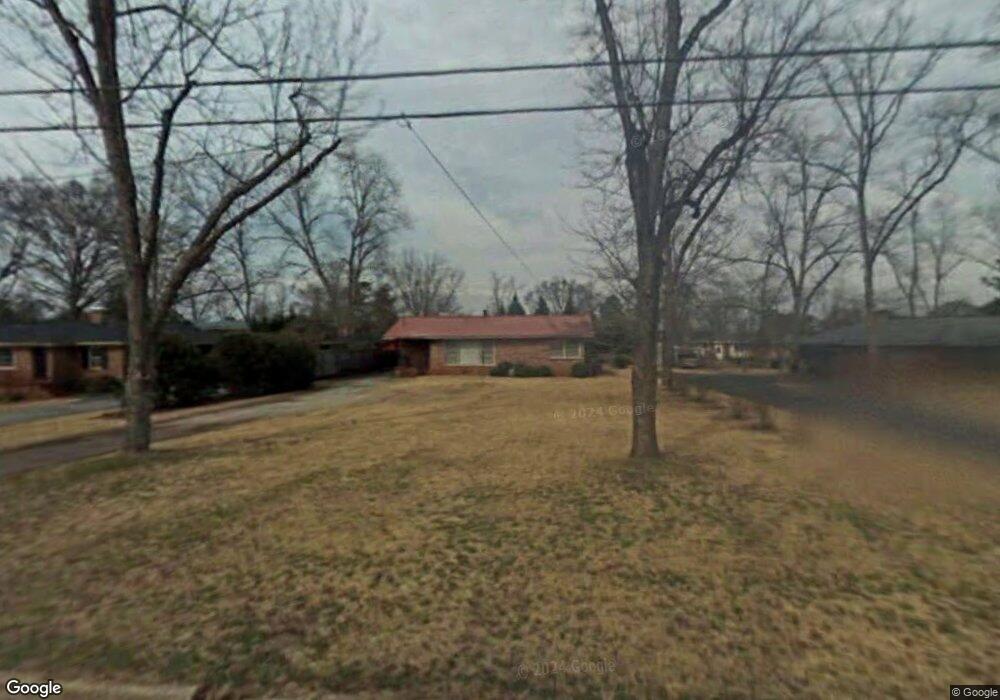
120 S Chilton Crescent Lagrange, GA 30240
Estimated Value: $164,313 - $204,000
3
Beds
2
Baths
1,377
Sq Ft
$131/Sq Ft
Est. Value
About This Home
This home is located at 120 S Chilton Crescent, Lagrange, GA 30240 and is currently estimated at $180,078, approximately $130 per square foot. 120 S Chilton Crescent is a home located in Troup County with nearby schools including Franklin Forest Elementary School, Hollis Hand Elementary School, and Ethel W. Kight Elementary School.
Ownership History
Date
Name
Owned For
Owner Type
Purchase Details
Closed on
Apr 19, 1999
Sold by
Freeman Mary
Bought by
Reynolds Lula Ray
Current Estimated Value
Purchase Details
Closed on
Dec 30, 1996
Sold by
Christopher D Mccarthy
Bought by
Freeman Mary
Purchase Details
Closed on
May 28, 1993
Sold by
Newman Katherine
Bought by
Christopher D Mccarthy
Purchase Details
Closed on
Apr 1, 1992
Sold by
Newman Alan G Aka A G Newman
Bought by
Newman Katherine
Purchase Details
Closed on
Nov 11, 1976
Sold by
Shelnutt Phillip W and Shelnutt Betty
Bought by
Newman Alan G Aka A G Newman
Purchase Details
Closed on
Jul 1, 1969
Sold by
Nelson W C
Bought by
Shelnutt Phillip W and Shelnutt Betty
Purchase Details
Closed on
Feb 1, 1965
Sold by
Reynolds Lula Ray
Bought by
Nelson W C
Create a Home Valuation Report for This Property
The Home Valuation Report is an in-depth analysis detailing your home's value as well as a comparison with similar homes in the area
Home Values in the Area
Average Home Value in this Area
Purchase History
| Date | Buyer | Sale Price | Title Company |
|---|---|---|---|
| Reynolds Lula Ray | $76,900 | -- | |
| Brown Tony L | $76,900 | -- | |
| Freeman Mary | $67,000 | -- | |
| Christopher D Mccarthy | $54,000 | -- | |
| Newman Katherine | -- | -- | |
| Newman Alan G Aka A G Newman | $31,000 | -- | |
| Shelnutt Phillip W | $13,500 | -- | |
| Nelson W C | -- | -- |
Source: Public Records
Tax History Compared to Growth
Tax History
| Year | Tax Paid | Tax Assessment Tax Assessment Total Assessment is a certain percentage of the fair market value that is determined by local assessors to be the total taxable value of land and additions on the property. | Land | Improvement |
|---|---|---|---|---|
| 2024 | $1,229 | $55,024 | $4,280 | $50,744 |
| 2023 | $883 | $42,312 | $4,280 | $38,032 |
| 2022 | $844 | $40,192 | $4,280 | $35,912 |
| 2021 | $485 | $26,016 | $4,280 | $21,736 |
| 2020 | $485 | $26,016 | $4,280 | $21,736 |
| 2019 | $422 | $23,944 | $4,200 | $19,744 |
| 2018 | $422 | $23,944 | $4,200 | $19,744 |
| 2017 | $422 | $23,944 | $4,200 | $19,744 |
| 2016 | $405 | $23,338 | $4,200 | $19,138 |
| 2015 | $410 | $23,438 | $4,301 | $19,138 |
| 2014 | $380 | $22,431 | $4,301 | $18,130 |
| 2013 | -- | $24,030 | $4,328 | $19,702 |
Source: Public Records
Map
Nearby Homes
- 106 S Chilton Crescent
- 201 S Chilton Crescent
- 203 S Chilton Crescent
- 100 Creekside Dr Unit LOT 60A
- 107 Dixie Creek Dr
- 724 Camellia Dr
- 106 Ewing St
- 102 Ewing St
- 145 Turner St
- 748 Lakewood Dr
- 204 Colonial St
- 110 Russell St
- 806 New Franklin Rd
- 900 North St
- 114 Briarcliff Rd
- 109 Thomas St
- 134 S Page St
- 219 Banks St
- 127 Ashling Dr
- 400 S Page St
- 116 S Chilton Crescent
- 124 S Chilton Crescent
- S S Chilton Crescent Unit 6
- S S Chilton Crescent Unit 30/1/2OF31
- S S Chilton Crescent
- 113 N Chilton Crescent
- 119 N Chilton Crescent
- 111 N Chilton Crescent
- 119 S Chilton Crescent
- 123 S Chilton Crescent
- 128 S Chilton Crescent
- 121 N Chilton Crescent
- 109 N Chilton Crescent
- 112 S Chilton Crescent
- 113 S Chilton Crescent
- 123 N Chilton Crescent
- 125 S Chilton Crescent
- 1016 Malibu Dr
- 110 S Chilton Crescent
- 114 N Chilton Crescent