Estimated Value: $110,325 - $536,000
--
Bed
--
Bath
1,380
Sq Ft
$265/Sq Ft
Est. Value
About This Home
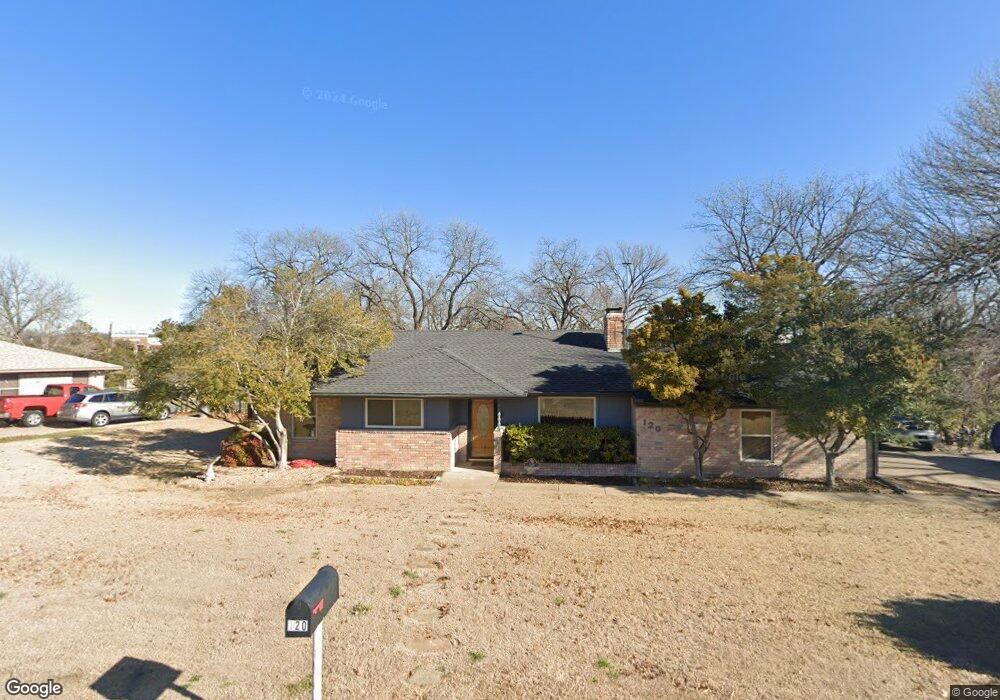
This home is located at 120 S Maxwell Creek Rd, Wylie, TX 75098 and is currently estimated at $365,581, approximately $264 per square foot. 120 S Maxwell Creek Rd is a home located in Collin County with nearby schools including Miller Elementary School, Murphy Middle School, and C A Mcmillen High School.
Ownership History
Date
Name
Owned For
Owner Type
Purchase Details
Closed on
Apr 18, 2019
Sold by
Smith William
Bought by
Pennington Jodie L
Current Estimated Value
Purchase Details
Closed on
Sep 29, 2005
Sold by
Pennington Jodie L
Bought by
Pennington Jodie L and Pennington Stephanie C
Purchase Details
Closed on
Sep 18, 1995
Sold by
Dietz James and Dietz Sharon B
Bought by
Pennington Jodie L
Home Financials for this Owner
Home Financials are based on the most recent Mortgage that was taken out on this home.
Original Mortgage
$77,761
Interest Rate
7.77%
Mortgage Type
FHA
Purchase Details
Closed on
Sep 14, 1995
Sold by
Watts Curtis B and Watts Mildred
Bought by
Dietz James and Dietz Sharon B
Home Financials for this Owner
Home Financials are based on the most recent Mortgage that was taken out on this home.
Original Mortgage
$77,761
Interest Rate
7.77%
Mortgage Type
FHA
Create a Home Valuation Report for This Property
The Home Valuation Report is an in-depth analysis detailing your home's value as well as a comparison with similar homes in the area
Home Values in the Area
Average Home Value in this Area
Purchase History
| Date | Buyer | Sale Price | Title Company |
|---|---|---|---|
| Pennington Jodie L | -- | None Available | |
| Pennington Jodie L | -- | -- | |
| Pennington Jodie L | -- | -- | |
| Dietz James | -- | -- |
Source: Public Records
Mortgage History
| Date | Status | Borrower | Loan Amount |
|---|---|---|---|
| Previous Owner | Pennington Jodie L | $77,761 |
Source: Public Records
Tax History Compared to Growth
Tax History
| Year | Tax Paid | Tax Assessment Tax Assessment Total Assessment is a certain percentage of the fair market value that is determined by local assessors to be the total taxable value of land and additions on the property. | Land | Improvement |
|---|---|---|---|---|
| 2025 | $215 | $38,049 | $12,211 | $31,088 |
| 2024 | $215 | $34,590 | $12,211 | $30,601 |
| 2023 | $215 | $31,445 | $4,163 | $27,282 |
| 2022 | $593 | $30,261 | $4,163 | $28,192 |
| 2021 | $568 | $30,271 | $4,163 | $26,108 |
| 2020 | $3,482 | $166,729 | $25,901 | $140,828 |
| 2019 | $3,685 | $168,174 | $25,901 | $142,273 |
| 2018 | $3,497 | $158,140 | $25,901 | $142,857 |
| 2017 | $3,179 | $143,764 | $25,901 | $117,863 |
| 2016 | $3,120 | $148,863 | $25,901 | $122,962 |
| 2015 | $2,510 | $126,743 | $22,201 | $104,542 |
Source: Public Records
Map
Nearby Homes
- 600 E Fm 544
- Pampa Farmhouse Plan at Crescent Hill
- 110 Birch Blvd
- 113 Birch Blvd
- LOT#2 S Maxwell Creek Rd
- 356 Willow Wood St
- 402 S Maxwell Creek Rd
- 342 Willow Wood St
- 465 Kinney Dr
- 322 Willow Wood St
- 3600 Nandina Dr
- 404 Crepe Myrtle Ln
- 401 N Maxwell Creek Rd
- 248 Mimosa Dr
- 237 Mimosa Dr
- 202 Sweetgum Dr
- 413 Royal Oak Dr
- 3203 Amber Waves Ln
- 3207 Wedgewood Way
- Lot#1 S Maxwell Creek Rd
- 116 S Maxwell Creek Rd
- 123 S Maxwell Creek Rd
- 123 S Maxwell Creek Rd
- 112 S Maxwell Creek Rd
- 117 S Maxwell Creek Rd
- 3750 W Fm 544
- 127 S Maxwell Creek Rd
- 108 S Maxwell Creek Rd
- 3740 W Fm 544
- 128 S Maxwell Creek Rd
- 110 Birch Blvd Unit 36357884
- 110 Birch Blvd Unit 36357885
- 110 Birch Blvd Unit 36357886
- 110 Birch Blvd Unit 36357887
- 110 Birch Blvd Unit 36357883
- 104 S Maxwell Creek Rd
- 133 S Maxwell Creek Rd
- 141 S Maxwell Creek Rd
- 424 Oak Glen Dr
- 419 Woodcrest Cir