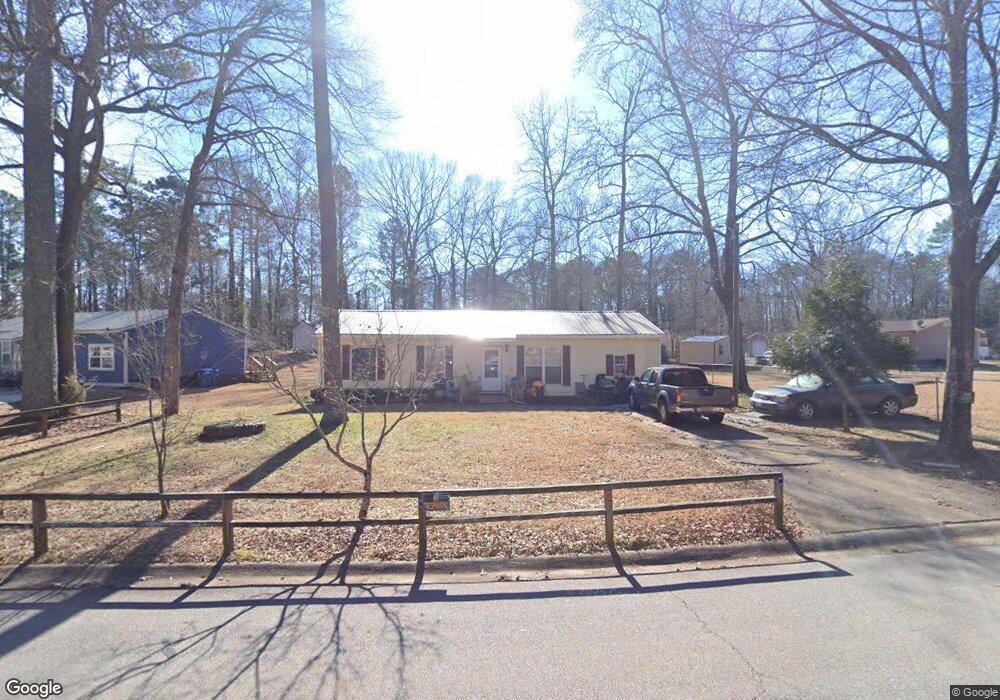
120 Sarsen Cir Bogart, GA 30622
Estimated Value: $208,113 - $263,000
3
Beds
1
Bath
1,300
Sq Ft
$189/Sq Ft
Est. Value
About This Home
This home is located at 120 Sarsen Cir, Bogart, GA 30622 and is currently estimated at $246,278, approximately $189 per square foot. 120 Sarsen Cir is a home located in Clarke County with nearby schools including Cleveland Road Elementary School, Burney-Harris-Lyons Middle School, and Clarke Central High School.
Ownership History
Date
Name
Owned For
Owner Type
Purchase Details
Closed on
May 18, 2007
Sold by
Not Provided
Bought by
Parks Richard
Current Estimated Value
Home Financials for this Owner
Home Financials are based on the most recent Mortgage that was taken out on this home.
Original Mortgage
$72,900
Outstanding Balance
$44,005
Interest Rate
6.12%
Mortgage Type
New Conventional
Estimated Equity
$202,274
Purchase Details
Closed on
Sep 29, 2006
Sold by
Not Provided
Bought by
Parks Richard
Purchase Details
Closed on
Feb 7, 2006
Sold by
Not Provided
Bought by
Parks Richard
Purchase Details
Closed on
May 22, 1996
Sold by
Schuler Barbara J
Bought by
Schuler Linda Lee
Purchase Details
Closed on
Feb 20, 1995
Sold by
Schuler George A
Bought by
Schuler Barbara J
Purchase Details
Closed on
Dec 19, 1989
Sold by
George R Lawrence
Bought by
Schuler George A
Create a Home Valuation Report for This Property
The Home Valuation Report is an in-depth analysis detailing your home's value as well as a comparison with similar homes in the area
Home Values in the Area
Average Home Value in this Area
Purchase History
| Date | Buyer | Sale Price | Title Company |
|---|---|---|---|
| Parks Richard | $72,900 | -- | |
| Parks Richard | -- | -- | |
| Parks Richard | $62,621 | -- | |
| Parks Richard | $62,621 | -- | |
| Schuler Linda Lee | -- | -- | |
| Schuler Barbara J | -- | -- | |
| Schuler George A | -- | -- |
Source: Public Records
Mortgage History
| Date | Status | Borrower | Loan Amount |
|---|---|---|---|
| Open | Parks Richard | $72,900 |
Source: Public Records
Tax History Compared to Growth
Tax History
| Year | Tax Paid | Tax Assessment Tax Assessment Total Assessment is a certain percentage of the fair market value that is determined by local assessors to be the total taxable value of land and additions on the property. | Land | Improvement |
|---|---|---|---|---|
| 2025 | $564 | $49,832 | $12,000 | $37,832 |
| 2024 | $564 | $47,294 | $12,000 | $35,294 |
| 2023 | $568 | $40,391 | $10,400 | $29,991 |
| 2022 | $611 | $34,421 | $10,400 | $24,021 |
| 2021 | $559 | $28,206 | $5,600 | $22,606 |
| 2020 | $546 | $27,292 | $5,600 | $21,692 |
| 2019 | $525 | $25,469 | $5,600 | $19,869 |
| 2018 | $509 | $25,001 | $4,800 | $20,201 |
| 2017 | $420 | $22,368 | $4,800 | $17,568 |
| 2016 | $362 | $20,656 | $4,800 | $15,856 |
| 2015 | $299 | $18,777 | $4,800 | $13,977 |
| 2014 | $313 | $19,155 | $4,800 | $14,355 |
Source: Public Records
Map
Nearby Homes
- 116 Sarsen Cir
- 130 Sarsen Cir
- 215 Marlborough Downs Rd
- 140 Sarsen Cir
- 205 Marlborough Downs Rd
- 225 Marlborough Downs Rd
- 115 Sarsen Cir
- 117 Sarsen Cir
- 125 Sarsen Cir
- 119 Sarsen Cir
- 105 Sarsen Cir
- 150 Sarsen Cir
- 135 Sarsen Cir
- 235 Marlborough Downs Rd
- 145 Sarsen Cir
- 12 Marlborough Downs Rd
- 0 Marlborough Downs Rd Unit 8890246
- 0 Marlborough Downs Rd Unit 8802574
- 0 Marlborough Downs Rd Unit 8596886
- 0 Marlborough Downs Rd Unit 8530618