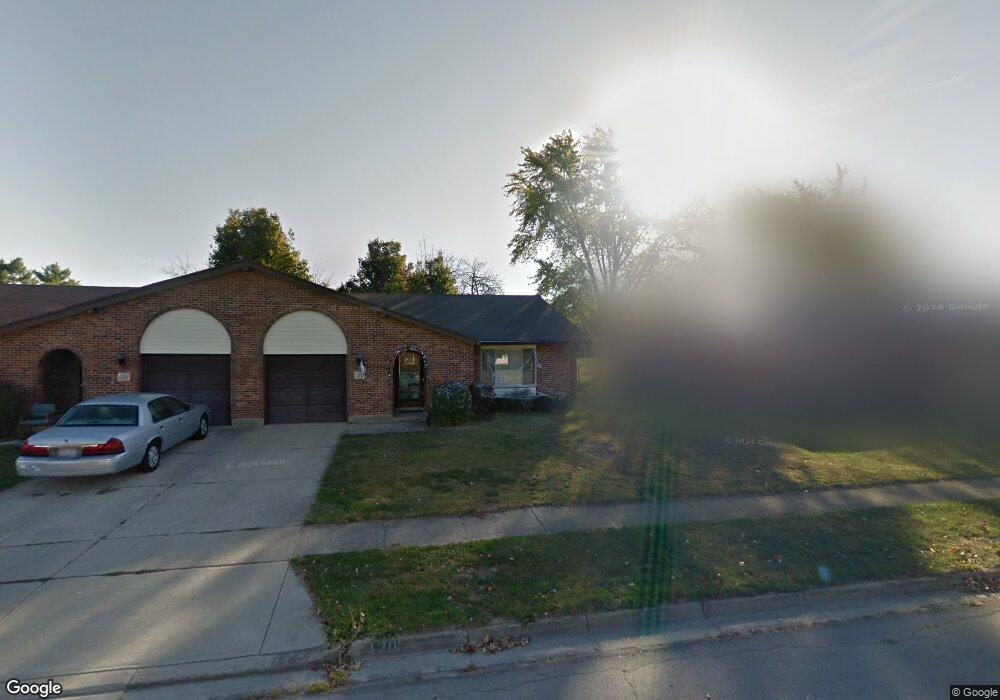
120 Scott Dr Englewood, OH 45322
Estimated Value: $254,000 - $335,351
4
Beds
2
Baths
2,761
Sq Ft
$101/Sq Ft
Est. Value
About This Home
This home is located at 120 Scott Dr, Englewood, OH 45322 and is currently estimated at $280,088, approximately $101 per square foot. 120 Scott Dr is a home located in Montgomery County with nearby schools including Northmont High School and Salem Christian Academy.
Ownership History
Date
Name
Owned For
Owner Type
Purchase Details
Closed on
Oct 21, 2020
Sold by
Meista Kushal
Bought by
Lambay Investments Llc
Current Estimated Value
Home Financials for this Owner
Home Financials are based on the most recent Mortgage that was taken out on this home.
Original Mortgage
$112,500
Interest Rate
2.7%
Mortgage Type
New Conventional
Purchase Details
Closed on
Oct 19, 2020
Sold by
Helton Randal L and Helton Family Preservation Tru
Bought by
Mehta Kushal
Home Financials for this Owner
Home Financials are based on the most recent Mortgage that was taken out on this home.
Original Mortgage
$112,500
Interest Rate
2.7%
Mortgage Type
New Conventional
Purchase Details
Closed on
Jul 20, 2010
Sold by
Helton Boyd D and Helton Vivian D
Bought by
Helton Randal L
Purchase Details
Closed on
Sep 17, 1999
Sold by
Dues Dennis B and Dues Shirley M
Bought by
Helton Boyd and Helton Vivian
Create a Home Valuation Report for This Property
The Home Valuation Report is an in-depth analysis detailing your home's value as well as a comparison with similar homes in the area
Home Values in the Area
Average Home Value in this Area
Purchase History
| Date | Buyer | Sale Price | Title Company |
|---|---|---|---|
| Lambay Investments Llc | -- | None Available | |
| Mehta Kushal | $150,000 | None Available | |
| Helton Randal L | -- | Attorney | |
| Helton Boyd | $131,500 | Midwest Abstract Company |
Source: Public Records
Mortgage History
| Date | Status | Borrower | Loan Amount |
|---|---|---|---|
| Previous Owner | Mehta Kushal | $112,500 |
Source: Public Records
Tax History Compared to Growth
Tax History
| Year | Tax Paid | Tax Assessment Tax Assessment Total Assessment is a certain percentage of the fair market value that is determined by local assessors to be the total taxable value of land and additions on the property. | Land | Improvement |
|---|---|---|---|---|
| 2024 | $5,119 | $87,480 | $13,020 | $74,460 |
| 2023 | $5,119 | $87,480 | $13,020 | $74,460 |
| 2022 | $4,108 | $53,970 | $8,040 | $45,930 |
| 2021 | $4,296 | $53,970 | $8,040 | $45,930 |
| 2020 | $4,049 | $53,970 | $8,040 | $45,930 |
| 2019 | $3,922 | $46,890 | $8,040 | $38,850 |
| 2018 | $3,854 | $46,890 | $8,040 | $38,850 |
| 2017 | $3,830 | $46,890 | $8,040 | $38,850 |
| 2016 | $3,654 | $43,920 | $8,040 | $35,880 |
| 2015 | $3,350 | $43,920 | $8,040 | $35,880 |
| 2014 | $3,350 | $43,920 | $8,040 | $35,880 |
| 2012 | -- | $54,140 | $8,980 | $45,160 |
Source: Public Records
Map
Nearby Homes
- 604 Heather St
- 408 W Herr St
- 320 Camborne Dr
- 332 Beckenham Rd
- 322 Rankin Dr
- 321 Rankin Dr
- 4005 Clearstream Way
- 308 Magnolia Ave
- 118 Elm Ct
- 123 Chestnut St
- 306 Pauly Dr
- 208 S Walnut St
- 2004 Clearstream Way
- 430 N Main St
- 109 Silverstone Dr
- 308 Sagebrush Dr
- 607 Albert St
- 206 Lodestone Dr
- 534 Unger Ave
- 114 Brumbaugh Ct