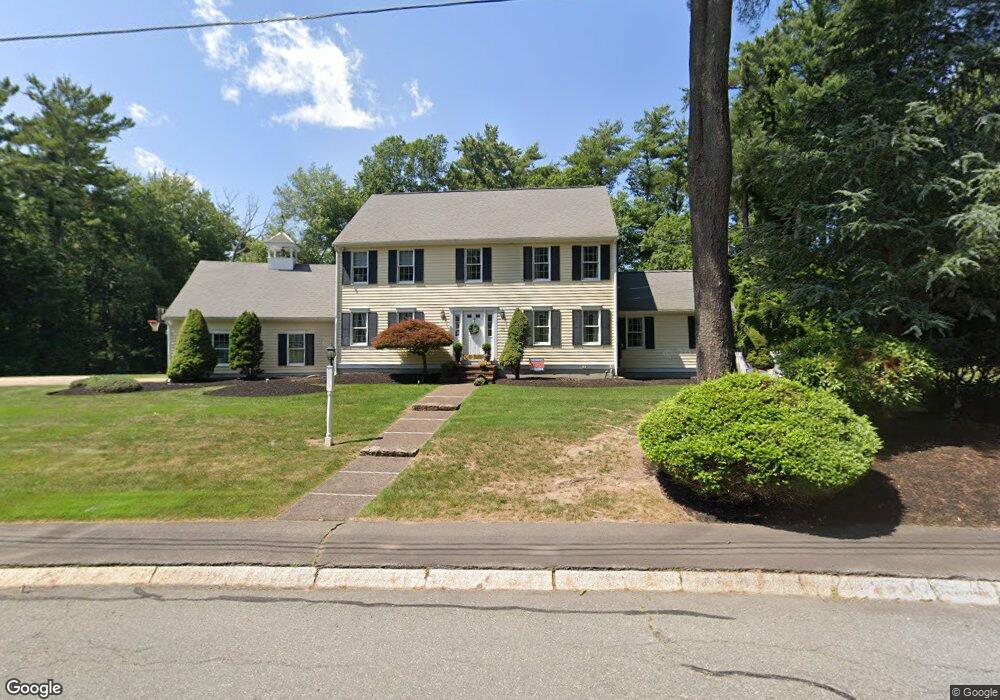
120 Sharon Ct Bridgewater, MA 02324
Estimated Value: $785,537 - $901,000
4
Beds
3
Baths
2,384
Sq Ft
$349/Sq Ft
Est. Value
About This Home
This home is located at 120 Sharon Ct, Bridgewater, MA 02324 and is currently estimated at $832,384, approximately $349 per square foot. 120 Sharon Ct is a home located in Plymouth County with nearby schools including Mitchell Elementary School, Williams Intermediate School, and Bridgewater Middle School.
Ownership History
Date
Name
Owned For
Owner Type
Purchase Details
Closed on
Sep 30, 1997
Sold by
Turner John R and Turner David W
Bought by
Cummings Kristin A and Norton Christopher C
Current Estimated Value
Home Financials for this Owner
Home Financials are based on the most recent Mortgage that was taken out on this home.
Original Mortgage
$190,000
Interest Rate
7.47%
Mortgage Type
Purchase Money Mortgage
Create a Home Valuation Report for This Property
The Home Valuation Report is an in-depth analysis detailing your home's value as well as a comparison with similar homes in the area
Home Values in the Area
Average Home Value in this Area
Purchase History
| Date | Buyer | Sale Price | Title Company |
|---|---|---|---|
| Cummings Kristin A | $250,000 | -- |
Source: Public Records
Mortgage History
| Date | Status | Borrower | Loan Amount |
|---|---|---|---|
| Open | Cummings Kristin A | $150,000 | |
| Closed | Cummings Kristin A | $75,000 | |
| Closed | Cummings Kristin A | $128,500 | |
| Closed | Cummings Kristin A | $190,000 |
Source: Public Records
Tax History
| Year | Tax Paid | Tax Assessment Tax Assessment Total Assessment is a certain percentage of the fair market value that is determined by local assessors to be the total taxable value of land and additions on the property. | Land | Improvement |
|---|---|---|---|---|
| 2025 | $8,345 | $705,400 | $236,500 | $468,900 |
| 2024 | $8,179 | $673,700 | $225,300 | $448,400 |
| 2023 | $8,102 | $631,000 | $210,500 | $420,500 |
| 2022 | $7,943 | $554,700 | $184,700 | $370,000 |
| 2021 | $30 | $516,200 | $164,900 | $351,300 |
| 2020 | $7,321 | $497,000 | $158,500 | $338,500 |
| 2019 | $7,201 | $485,600 | $158,500 | $327,100 |
| 2018 | $6,095 | $465,200 | $154,000 | $311,200 |
| 2017 | $6,818 | $436,800 | $154,000 | $282,800 |
| 2016 | $6,514 | $419,200 | $151,000 | $268,200 |
| 2015 | $6,554 | $403,600 | $146,500 | $257,100 |
| 2014 | $6,422 | $395,200 | $142,200 | $253,000 |
Source: Public Records
Map
Nearby Homes
- 3 Caswell Way
- 199 Cherry St
- 0 Auburn St
- 211 Cherry St
- 73 Pratt Ave
- 829 Auburn St
- 101 Pratt Ave
- 44 Titicut Ave Unit Lot 45
- 46 Titicut Ave
- 150 Prattown Ln
- 17 Forbes Rd Unit Lot 64
- 0 Flagg St Unit 73421818
- Lot 1 Mill St
- 74 Magnolia Way
- 35 Nelson Dr
- 225 Whitman St
- 215 Whitman St
- 114 Plain St
- 5 Country Dr
- 398 Plymouth St
- 140 Sharon Ct
- 125 Sharon Ct
- 30 Carriage House Dr
- 135 Sharon Ct
- 40 Carriage House Dr
- 20 Carriage House Dr
- 105 Sharon Ct
- 10 Carriage House Dr
- 110 Sharon Ct
- 427 Walnut St
- 493 Walnut St
- 483 Walnut St
- 445 Walnut St
- 25 Carriage House Dr
- 95 Sharon Ct
- 15 Carriage House Dr
- 415 Walnut St
- 35 Carriage House Dr
- 100 Sharon Ct
- 503 Walnut St
Your Personal Tour Guide
Ask me questions while you tour the home.