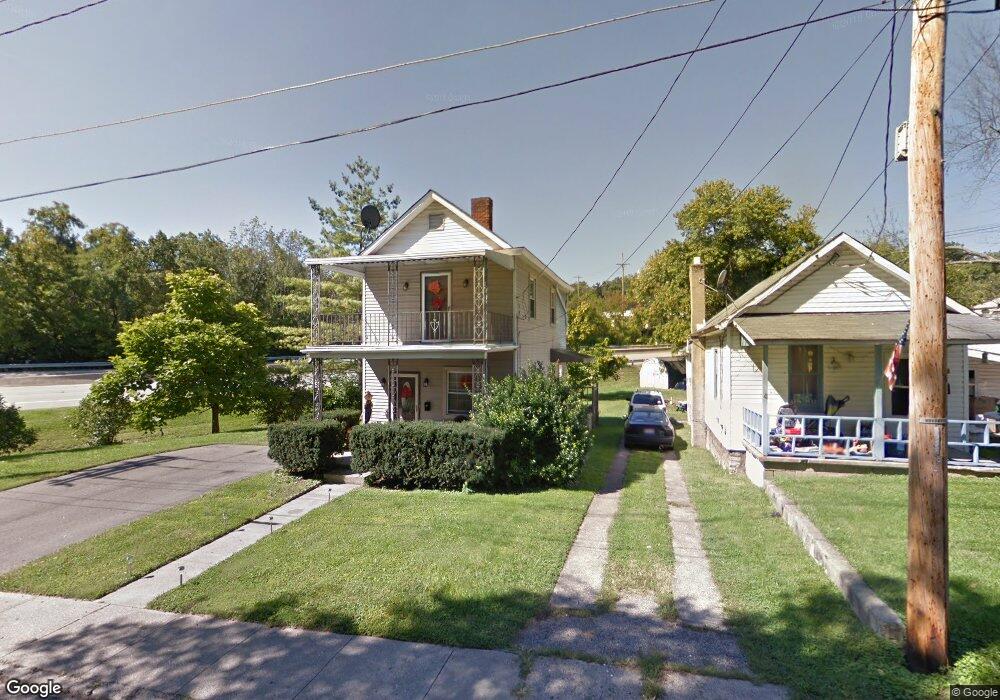
120 Shawnee St North Bend, OH 45052
Estimated Value: $126,253 - $192,000
2
Beds
1
Bath
1,037
Sq Ft
$142/Sq Ft
Est. Value
About This Home
This home is located at 120 Shawnee St, North Bend, OH 45052 and is currently estimated at $147,063, approximately $141 per square foot. 120 Shawnee St is a home located in Hamilton County with nearby schools including Charles T. Young Elementary School, Taylor Middle School, and Taylor High School.
Ownership History
Date
Name
Owned For
Owner Type
Purchase Details
Closed on
Mar 30, 2018
Sold by
Taylor Steven W and Taylor Debra J
Bought by
Dunklin Anthony H
Current Estimated Value
Home Financials for this Owner
Home Financials are based on the most recent Mortgage that was taken out on this home.
Original Mortgage
$31,420
Outstanding Balance
$27,433
Interest Rate
5.12%
Mortgage Type
FHA
Estimated Equity
$119,630
Purchase Details
Closed on
Oct 11, 2011
Sold by
Secretary Of Housing & Urban Development
Bought by
Taylor Steven W and Taylor Debra J
Purchase Details
Closed on
Feb 8, 2011
Sold by
Bunch John S and Bunch Tracy R
Bought by
Citimortgage Inc
Purchase Details
Closed on
Feb 7, 2011
Sold by
Citimortgage Inc
Bought by
Secretary Of Housing & Urban Development
Purchase Details
Closed on
Jul 31, 2002
Sold by
Taylor Michael T and Taylor Laurel A
Bought by
Bunch John S and Bunch Tracy R
Create a Home Valuation Report for This Property
The Home Valuation Report is an in-depth analysis detailing your home's value as well as a comparison with similar homes in the area
Home Values in the Area
Average Home Value in this Area
Purchase History
| Date | Buyer | Sale Price | Title Company |
|---|---|---|---|
| Dunklin Anthony H | $32,000 | None Available | |
| Taylor Steven W | $13,000 | Attorney | |
| Citimortgage Inc | $63,547 | None Available | |
| Secretary Of Housing & Urban Development | -- | None Available | |
| Bunch John S | $62,000 | -- |
Source: Public Records
Mortgage History
| Date | Status | Borrower | Loan Amount |
|---|---|---|---|
| Open | Dunklin Anthony H | $31,420 |
Source: Public Records
Tax History Compared to Growth
Tax History
| Year | Tax Paid | Tax Assessment Tax Assessment Total Assessment is a certain percentage of the fair market value that is determined by local assessors to be the total taxable value of land and additions on the property. | Land | Improvement |
|---|---|---|---|---|
| 2024 | $2,973 | $26,163 | $4,116 | $22,047 |
| 2023 | $1,373 | $26,163 | $4,116 | $22,047 |
| 2022 | $906 | $10,808 | $3,843 | $6,965 |
| 2021 | $687 | $10,808 | $3,843 | $6,965 |
| 2020 | $667 | $10,808 | $3,843 | $6,965 |
| 2019 | $845 | $13,118 | $3,430 | $9,688 |
| 2018 | $782 | $13,118 | $3,430 | $9,688 |
| 2017 | $799 | $13,118 | $3,430 | $9,688 |
| 2016 | $257 | $4,228 | $3,157 | $1,071 |
| 2015 | $256 | $4,228 | $3,157 | $1,071 |
| 2014 | $258 | $4,228 | $3,157 | $1,071 |
| 2013 | $647 | $10,658 | $3,430 | $7,228 |
Source: Public Records
Map
Nearby Homes
- 7284 W Harrison Ave
- 21 Wamsley Ave
- 143 Mount Nebo Rd
- 118 Mount Nebo Rd
- 100 Mount Nebo Rd
- 42 Edinburgh Place Unit 42
- 36 Timberline Ct
- 0 Saint Annes Unit 1826785
- 101 E State Rd
- 540 Aston View Ln
- 110 Elliott St
- 505 Aston View Ln
- 517 E State Rd
- 301 N Miami Ave
- 2700 Rittenhouse Rd
- 8735 Bridgetown Rd
- 115 Fox Hills Ln
- 143 Fox Hills Ln
- 116 Scott St
- 108 Scott St