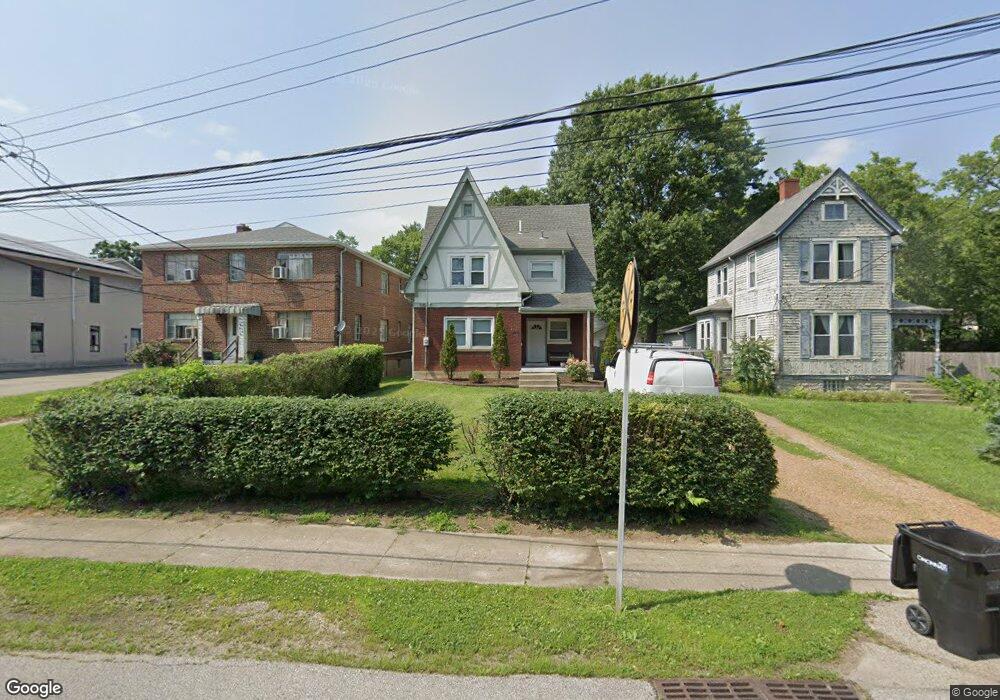
120 Sheehan Ave Cincinnati, OH 45216
Hartwell NeighborhoodEstimated Value: $180,000 - $207,000
3
Beds
2
Baths
1,566
Sq Ft
$124/Sq Ft
Est. Value
About This Home
This home is located at 120 Sheehan Ave, Cincinnati, OH 45216 and is currently estimated at $194,158, approximately $123 per square foot. 120 Sheehan Ave is a home located in Hamilton County with nearby schools including Rising Stars at Carthage, Hartwell School, and Shroder High School.
Ownership History
Date
Name
Owned For
Owner Type
Purchase Details
Closed on
Mar 31, 2011
Sold by
Floreani Douglas
Bought by
Atkinson Geoffrey
Current Estimated Value
Home Financials for this Owner
Home Financials are based on the most recent Mortgage that was taken out on this home.
Original Mortgage
$71,000
Outstanding Balance
$48,826
Interest Rate
5.04%
Mortgage Type
Seller Take Back
Estimated Equity
$145,332
Purchase Details
Closed on
Feb 4, 2010
Sold by
Stockburger Debora L
Bought by
Dcic Llc
Purchase Details
Closed on
Apr 4, 2007
Sold by
Stockburger Chuck M and Stockburger Debora L
Bought by
Stockburger Debora L and The Debora L Stockburger Revocable Trust
Purchase Details
Closed on
Feb 14, 2003
Sold by
Manufacturers & Traders Trust Co
Bought by
Stockburger Chuck M
Home Financials for this Owner
Home Financials are based on the most recent Mortgage that was taken out on this home.
Original Mortgage
$52,000
Interest Rate
5.94%
Purchase Details
Closed on
Aug 20, 2002
Sold by
Mccann Bruce E and Mccann Ann
Bought by
Manufacturers & Traders Trust Co
Create a Home Valuation Report for This Property
The Home Valuation Report is an in-depth analysis detailing your home's value as well as a comparison with similar homes in the area
Home Values in the Area
Average Home Value in this Area
Purchase History
| Date | Buyer | Sale Price | Title Company |
|---|---|---|---|
| Atkinson Geoffrey | $74,000 | None Available | |
| Floreani Douglas | -- | None Available | |
| Dcic Llc | $50,000 | Attorney | |
| Stockburger Debora L | -- | Attorney | |
| Stockburger Chuck M | $65,000 | -- | |
| Manufacturers & Traders Trust Co | $58,000 | -- |
Source: Public Records
Mortgage History
| Date | Status | Borrower | Loan Amount |
|---|---|---|---|
| Open | Atkinson Geoffrey | $71,000 | |
| Previous Owner | Stockburger Chuck M | $52,000 |
Source: Public Records
Tax History
| Year | Tax Paid | Tax Assessment Tax Assessment Total Assessment is a certain percentage of the fair market value that is determined by local assessors to be the total taxable value of land and additions on the property. | Land | Improvement |
|---|---|---|---|---|
| 2025 | $2,786 | $44,993 | $8,449 | $36,544 |
| 2024 | $2,707 | $44,993 | $8,449 | $36,544 |
| 2023 | $2,764 | $44,993 | $8,449 | $36,544 |
| 2022 | $1,759 | $25,606 | $7,973 | $17,633 |
| 2021 | $1,693 | $25,606 | $7,973 | $17,633 |
| 2020 | $1,738 | $25,606 | $7,973 | $17,633 |
| 2019 | $1,761 | $23,710 | $7,382 | $16,328 |
| 2018 | $1,764 | $23,710 | $7,382 | $16,328 |
| 2017 | $1,677 | $23,710 | $7,382 | $16,328 |
| 2016 | $1,197 | $16,626 | $7,382 | $9,244 |
| 2015 | $1,079 | $16,626 | $7,382 | $9,244 |
| 2014 | $1,086 | $16,626 | $7,382 | $9,244 |
| 2013 | $1,163 | $17,500 | $7,770 | $9,730 |
Source: Public Records
Map
Nearby Homes
- 8421 Wiswell St
- 42 Sheehan Ave
- 8338 Anthony Wayne Ave
- 342 Durrell Ave
- 8318 Marley St
- 25 Euclid Ave
- 177 Burns Ave
- 29 Hartwell Ct
- 241 Oakmont St
- 8415 Mayfair St
- 529 Elliott Ave
- 8081 Woodbine Ave
- 7871 Glenorchard Dr
- 163 Compton Rd
- 7831 Glen Orchard Dr
- 701 W Wyoming Ave
- 127 Locust St
- 334 Williams St
- 7829 Sunfield Dr
- 415 Arlington Ave
- 116 Sheehan Ave
- 124 Sheehan Ave
- 128 Sheehan Ave
- 132 Sheehan Ave
- 8402 Burns Ave
- 8377 Mace Ave
- 121 Hereford Ct
- 117 Hereford Ct
- 125 Hereford Ct
- 8378 Mace Ave
- 113 Hereford Ct
- 129 Hereford Ct
- 8373 Mace Ave
- 117 Hereford St
- 125 Hereford Ave
- 125 Hereford St
- 140 Sheehan Ave
- 135 Hereford Ct
- 8416 Burns Ave
- 125 Hereford Ct
Your Personal Tour Guide
Ask me questions while you tour the home.