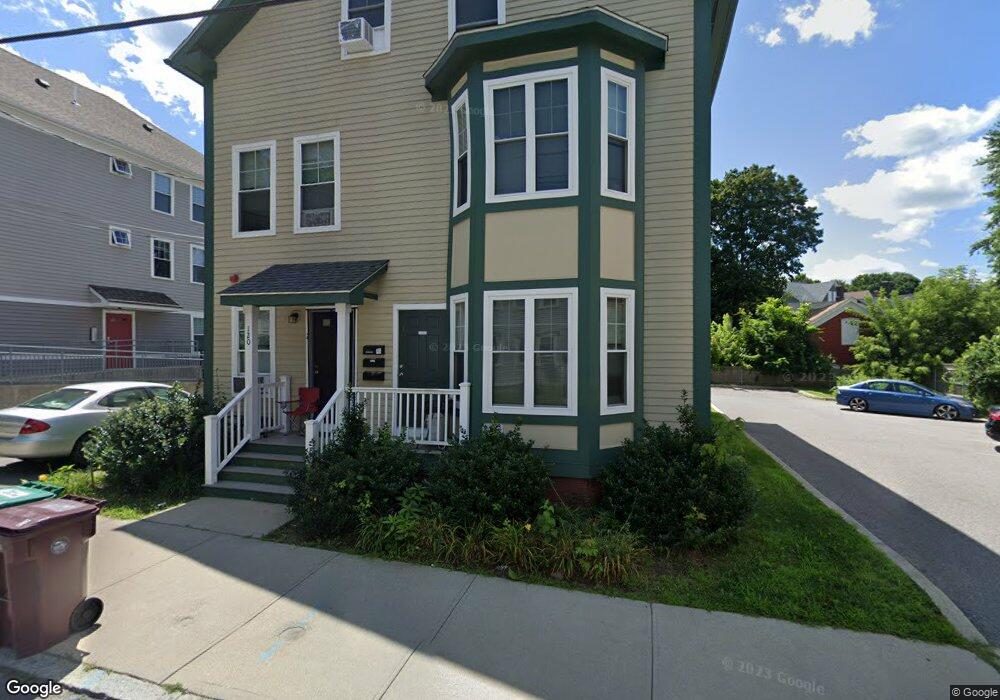
120 South St Woonsocket, RI 02895
Constitution Hill NeighborhoodEstimated Value: $356,346
7
Beds
3
Baths
3,048
Sq Ft
$117/Sq Ft
Est. Value
About This Home
This home is located at 120 South St, Woonsocket, RI 02895 and is currently estimated at $356,346, approximately $116 per square foot. 120 South St is a home located in Providence County with nearby schools including Woonsocket High School, Founders Academy, and Beacon Charter School.
Ownership History
Date
Name
Owned For
Owner Type
Purchase Details
Closed on
Feb 15, 2011
Sold by
Venture Ent Llc
Bought by
De Woonsocket Neighbor
Current Estimated Value
Purchase Details
Closed on
Feb 25, 2010
Sold by
Biernacki Vera
Bought by
Venture Enterprises Ll
Purchase Details
Closed on
Feb 12, 2010
Sold by
Venture Enterprises
Bought by
Biernacki Vera
Purchase Details
Closed on
Jun 25, 2008
Sold by
Avelo Mortgage Llc
Bought by
Venture Enterprises
Create a Home Valuation Report for This Property
The Home Valuation Report is an in-depth analysis detailing your home's value as well as a comparison with similar homes in the area
Home Values in the Area
Average Home Value in this Area
Purchase History
| Date | Buyer | Sale Price | Title Company |
|---|---|---|---|
| De Woonsocket Neighbor | $139,900 | -- | |
| Dewoonsocket Neighbor | $139,900 | -- | |
| Venture Enterprises Ll | -- | -- | |
| Venture Enterprises Ll | -- | -- | |
| Biernacki Vera | -- | -- | |
| Biernacki Vera | -- | -- | |
| Venture Enterprises | $80,000 | -- | |
| Venture Enterprises | $80,000 | -- |
Source: Public Records
Mortgage History
| Date | Status | Borrower | Loan Amount |
|---|---|---|---|
| Open | Venture Enterprises | $376,676 | |
| Closed | Venture Enterprises | $164,913 |
Source: Public Records
Tax History
| Year | Tax Paid | Tax Assessment Tax Assessment Total Assessment is a certain percentage of the fair market value that is determined by local assessors to be the total taxable value of land and additions on the property. | Land | Improvement |
|---|---|---|---|---|
| 2025 | $0 | $372,500 | $60,600 | $311,900 |
| 2024 | $0 | $233,100 | $60,600 | $172,500 |
| 2023 | $0 | $233,100 | $60,600 | $172,500 |
| 2022 | $0 | $233,100 | $60,600 | $172,500 |
| 2021 | $0 | $150,400 | $35,600 | $114,800 |
| 2020 | $0 | $150,400 | $35,600 | $114,800 |
| 2018 | $0 | $148,400 | $33,600 | $114,800 |
| 2017 | $0 | $106,900 | $37,400 | $69,500 |
| 2016 | $4,616 | $106,900 | $37,400 | $69,500 |
| 2015 | $4,616 | $126,200 | $37,400 | $88,800 |
| 2014 | $4,464 | $124,200 | $41,200 | $83,000 |
Source: Public Records
Map
Nearby Homes
- 0 Holbrook Ln Unit 1402850
- 435 S Main St
- 83 4th Ave
- 123 4th Ave
- 168 3rd Ave
- 190 Coe St
- 80 Summit St
- 43 Summit St
- 36 Fairmount St
- 379 Front St
- 84 Bernice Ave
- 92 Rockland Ave
- 184 Avenue C Unit 2
- 184 Avenue C Unit 5
- 184 Avenue C Unit 6
- 184 Avenue C Unit 3
- 184 Avenue C Unit 4
- 184 Avenue C Unit 1
- 122 Grand St
- 99 Allen St Unit 205
Your Personal Tour Guide
Ask me questions while you tour the home.