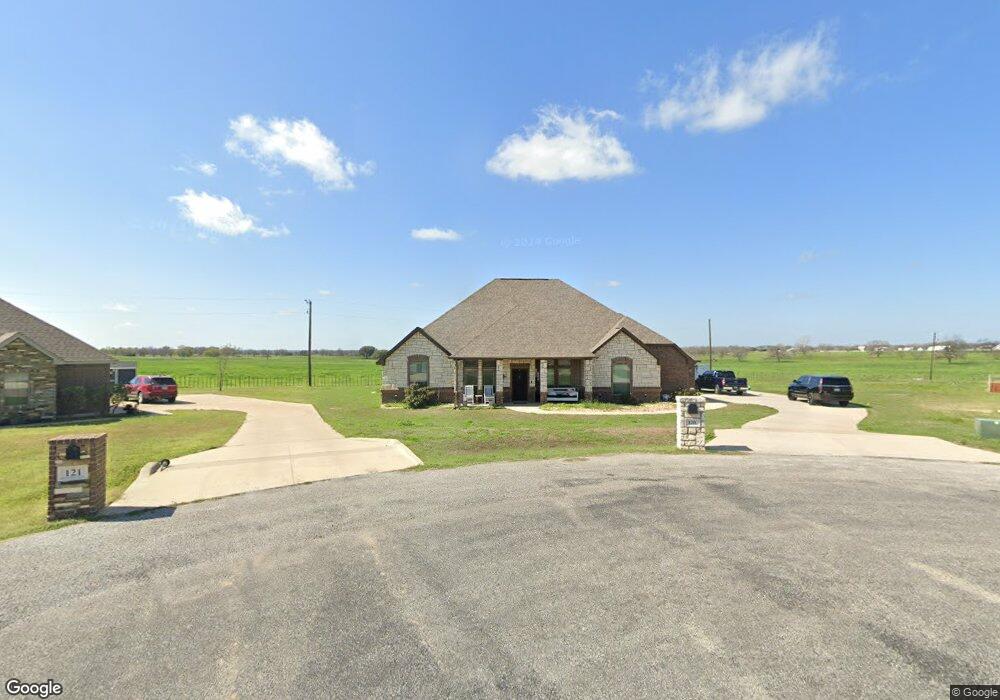
120 Spirit Ct Weatherford, TX 76087
Estimated Value: $514,000 - $557,000
5
Beds
3
Baths
2,462
Sq Ft
$215/Sq Ft
Est. Value
About This Home
This home is located at 120 Spirit Ct, Weatherford, TX 76087 and is currently estimated at $529,791, approximately $215 per square foot. 120 Spirit Ct is a home located in Parker County with nearby schools including Brock Intermediate School, Brock Junior High School, and Brock High School.
Ownership History
Date
Name
Owned For
Owner Type
Purchase Details
Closed on
May 18, 2018
Sold by
Stewart Justin and Stewart Angela
Bought by
Montez Erick and Taylor Bailey Michelle
Current Estimated Value
Home Financials for this Owner
Home Financials are based on the most recent Mortgage that was taken out on this home.
Original Mortgage
$338,751
Outstanding Balance
$296,346
Interest Rate
5.12%
Mortgage Type
FHA
Estimated Equity
$233,445
Purchase Details
Closed on
Feb 5, 2015
Sold by
Brock Builders Llc
Bought by
Stewart Justin and Stewart Angela
Home Financials for this Owner
Home Financials are based on the most recent Mortgage that was taken out on this home.
Original Mortgage
$257,839
Interest Rate
3.89%
Mortgage Type
New Conventional
Purchase Details
Closed on
May 21, 2014
Sold by
Atwood William D and Atwood Rosemary
Bought by
Stewart Justin and Stewart Angela
Create a Home Valuation Report for This Property
The Home Valuation Report is an in-depth analysis detailing your home's value as well as a comparison with similar homes in the area
Home Values in the Area
Average Home Value in this Area
Purchase History
| Date | Buyer | Sale Price | Title Company |
|---|---|---|---|
| Montez Erick | -- | Providence Title Company | |
| Stewart Justin | -- | None Available | |
| Stewart Justin | -- | -- |
Source: Public Records
Mortgage History
| Date | Status | Borrower | Loan Amount |
|---|---|---|---|
| Open | Montez Erick | $338,751 | |
| Previous Owner | Stewart Justin | $257,839 |
Source: Public Records
Tax History Compared to Growth
Tax History
| Year | Tax Paid | Tax Assessment Tax Assessment Total Assessment is a certain percentage of the fair market value that is determined by local assessors to be the total taxable value of land and additions on the property. | Land | Improvement |
|---|---|---|---|---|
| 2025 | $6,765 | $476,970 | -- | -- |
| 2024 | $6,765 | $433,609 | -- | -- |
| 2023 | $6,765 | $394,190 | $0 | $0 |
| 2022 | $7,275 | $358,360 | $45,000 | $313,360 |
| 2021 | $7,412 | $358,360 | $45,000 | $313,360 |
| 2020 | $6,831 | $315,610 | $45,000 | $270,610 |
| 2019 | $7,356 | $315,610 | $45,000 | $270,610 |
| 2018 | $6,726 | $287,320 | $45,000 | $242,320 |
| 2017 | $6,610 | $287,320 | $45,000 | $242,320 |
| 2016 | $5,692 | $247,390 | $30,000 | $217,390 |
| 2015 | $1,916 | $84,350 | $30,000 | $54,350 |
| 2014 | $688 | $30,000 | $30,000 | $0 |
Source: Public Records
Map
Nearby Homes
- 140 Champion Ct
- 5068 Fm 1189
- 125 Heritage Springs Dr
- 129 Heritage Springs Dr
- 137 Heritage Springs Dr
- 113 Heritage Springs Dr
- 141 Heritage Springs Dr
- 109 Heritage Springs Dr
- 0000 Heritage Springs Dr
- 401 Taylor Rd
- 000 Salt Creek Ct
- 128 Heritage Springs Dr
- 101 Heritage Springs Dr
- 200 Salt Creek Ct
- 124 Heritage Springs Dr
- 205 Salt Creek Ct
- 145 Salt Creek Ct
- 209 Salt Creek Ct
- 104 Beaver Creek Ct
- 100 Beaver Creek Ct
- 116 Spirit Ct
- 121 Spirit Ct
- 112 Spirit Ct
- 117 Spirit Ct
- 167 Eagles Crest Ln
- 113 Spirit Ct
- 108 Spirit Ct
- 108 Spirit Ct
- 108 Spirit Ct
- 109 Spirit Ct
- 109 Spirit Ct
- 109 Spirit Ct
- 109 Spirit Ct
- 172 Eagles Crest Ln
- 109 Spirit Ct
- 109 Spirit Ct
- 163 Eagles Crest Ln
- 163 Eagles Crest Ln
- 104 Spirit Ct
- 27 Spirit Ct