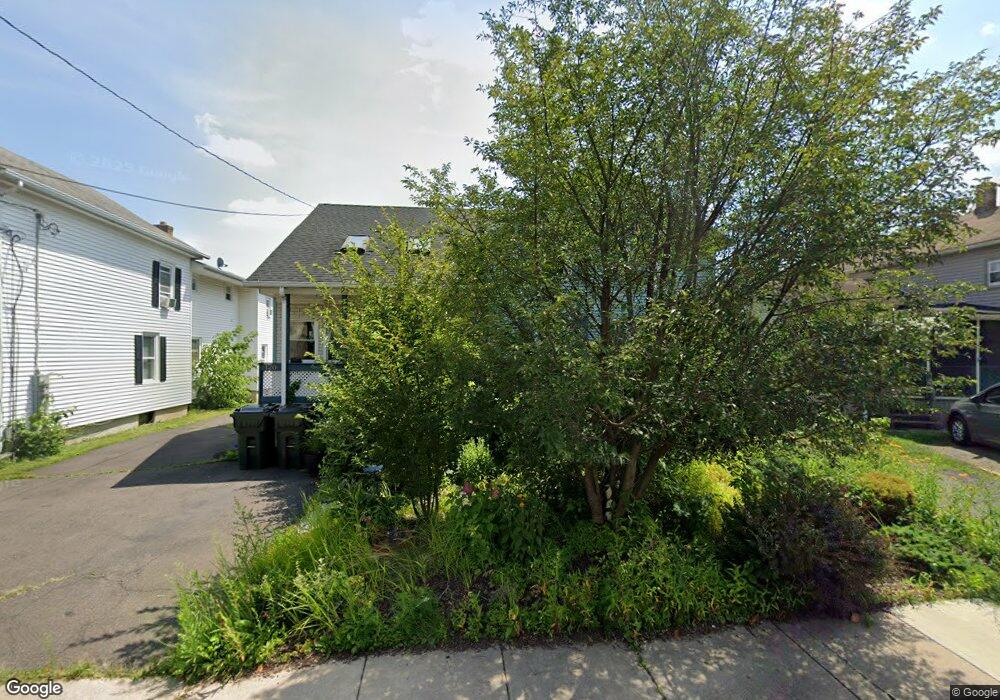
120 Spring St Windsor Locks, CT 06096
Estimated Value: $237,000 - $335,000
4
Beds
1
Bath
1,428
Sq Ft
$198/Sq Ft
Est. Value
About This Home
This home is located at 120 Spring St, Windsor Locks, CT 06096 and is currently estimated at $283,323, approximately $198 per square foot. 120 Spring St is a home located in Hartford County with nearby schools including North Street School, South Elementary School, and Windsor Locks Middle School.
Ownership History
Date
Name
Owned For
Owner Type
Purchase Details
Closed on
Feb 16, 2017
Sold by
Quinn Matthew G
Bought by
Sands Deborah M
Current Estimated Value
Purchase Details
Closed on
Apr 27, 2015
Sold by
Sands Douglas W
Bought by
Sands Deborah M
Home Financials for this Owner
Home Financials are based on the most recent Mortgage that was taken out on this home.
Original Mortgage
$147,028
Interest Rate
4.4%
Mortgage Type
FHA
Purchase Details
Closed on
Apr 9, 2010
Sold by
Est Pleva Richard and Pleva Jonathan
Bought by
Sands Douglas and Quinn Matthew
Home Financials for this Owner
Home Financials are based on the most recent Mortgage that was taken out on this home.
Original Mortgage
$127,645
Interest Rate
5.25%
Mortgage Type
FHA
Purchase Details
Closed on
Aug 12, 2005
Sold by
Paul Kenneth and Paul Cindy
Bought by
Pleva Richard
Purchase Details
Closed on
Jun 21, 1999
Sold by
Post Richard and Post Constance
Bought by
Paul Kenneth
Home Financials for this Owner
Home Financials are based on the most recent Mortgage that was taken out on this home.
Original Mortgage
$94,100
Interest Rate
6.99%
Create a Home Valuation Report for This Property
The Home Valuation Report is an in-depth analysis detailing your home's value as well as a comparison with similar homes in the area
Home Values in the Area
Average Home Value in this Area
Purchase History
| Date | Buyer | Sale Price | Title Company |
|---|---|---|---|
| Sands Deborah M | -- | -- | |
| Sands Deborah M | -- | -- | |
| Sands Douglas | $130,000 | -- | |
| Pleva Richard | $183,000 | -- | |
| Paul Kenneth | $94,900 | -- |
Source: Public Records
Mortgage History
| Date | Status | Borrower | Loan Amount |
|---|---|---|---|
| Previous Owner | Sands Deborah M | $147,028 | |
| Previous Owner | Paul Kenneth | $127,645 | |
| Previous Owner | Paul Kenneth | $94,100 |
Source: Public Records
Tax History
| Year | Tax Paid | Tax Assessment Tax Assessment Total Assessment is a certain percentage of the fair market value that is determined by local assessors to be the total taxable value of land and additions on the property. | Land | Improvement |
|---|---|---|---|---|
| 2025 | $3,948 | $164,570 | $53,550 | $111,020 |
| 2024 | $2,592 | $92,120 | $35,910 | $56,210 |
| 2023 | $2,426 | $92,120 | $35,910 | $56,210 |
| 2022 | $2,379 | $92,120 | $35,910 | $56,210 |
| 2021 | $2,379 | $92,120 | $35,910 | $56,210 |
| 2020 | $2,379 | $92,120 | $35,910 | $56,210 |
| 2019 | $2,379 | $92,120 | $35,910 | $56,210 |
| 2017 | $2,645 | $99,200 | $35,100 | $64,100 |
| 2016 | $2,645 | $99,200 | $35,100 | $64,100 |
| 2015 | $2,658 | $99,200 | $35,100 | $64,100 |
| 2014 | -- | $115,200 | $39,900 | $75,300 |
Source: Public Records
Map
Nearby Homes
- 202 Reed Ave
- 80 West St
- 59 Elm St
- 13 Jubrey Ln
- 102 Orchard Hill Dr
- 15 Suffield St
- 13 Quail Ct
- 20-22 Pleasant St
- 0 N Water St Unit 24138494
- 0 N Water St Unit 24128295
- 0 N Water St Unit 24128294
- 0 N Water St Unit 24128288
- 0 N Water St
- 19 Dean Ave
- 4 Woodland Hollow St
- 140 S Water St
- 404 Woodland St
- 24 Coolidge St
- 143 Bridge St
- 24 Bel-Aire Cir
Your Personal Tour Guide
Ask me questions while you tour the home.