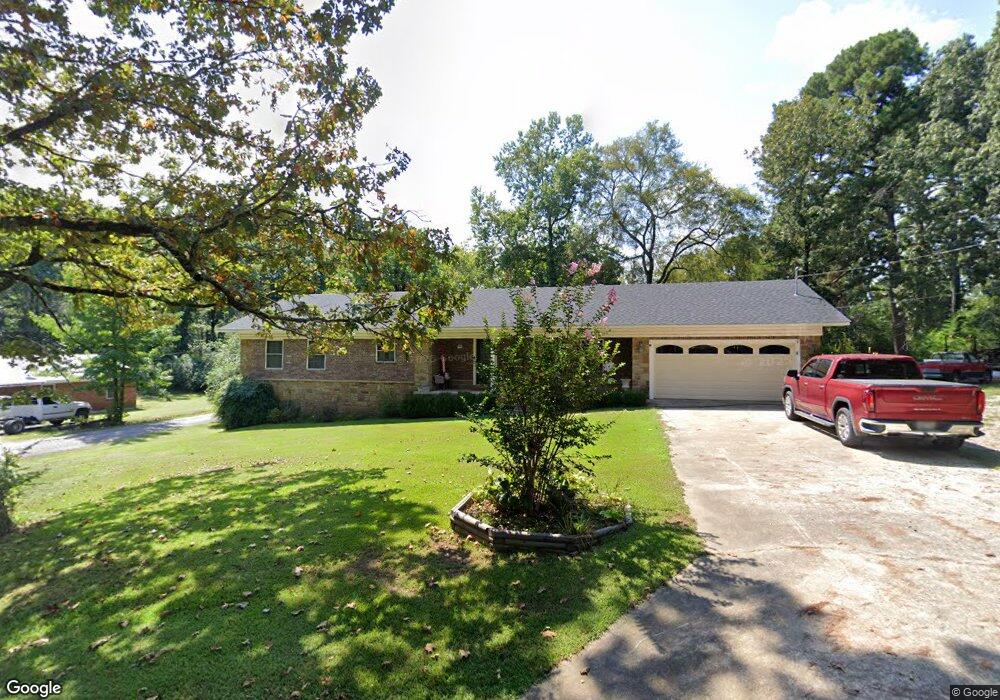
120 Sycamore St Hot Springs National Park, AR 71913
Estimated Value: $218,000 - $268,000
2
Beds
2
Baths
1,437
Sq Ft
$171/Sq Ft
Est. Value
About This Home
This home is located at 120 Sycamore St, Hot Springs National Park, AR 71913 and is currently estimated at $245,141, approximately $170 per square foot. 120 Sycamore St is a home located in Garland County with nearby schools including Lake Hamilton Primary School, Lake Hamilton Elementary School, and Lake Hamilton Interm. School.
Ownership History
Date
Name
Owned For
Owner Type
Purchase Details
Closed on
Aug 22, 2017
Sold by
Colvert James M
Bought by
Lindsey David and Lindsey Orie
Current Estimated Value
Purchase Details
Closed on
Aug 9, 2011
Sold by
Indymac Venture Llc
Bought by
Lindsey Orie A and Lindsey David W
Home Financials for this Owner
Home Financials are based on the most recent Mortgage that was taken out on this home.
Original Mortgage
$102,338
Interest Rate
4.25%
Mortgage Type
FHA
Purchase Details
Closed on
Apr 12, 2011
Sold by
Bardwell James
Bought by
Indymac Venture Llc
Purchase Details
Closed on
Nov 24, 1999
Sold by
Not Provided
Bought by
Bardwell David B
Purchase Details
Closed on
Nov 21, 1999
Sold by
Not Provided
Bought by
Bardwell David B
Purchase Details
Closed on
Sep 18, 1996
Sold by
Not Provided
Bought by
Bardwell David B and Bardwell Laura A
Purchase Details
Closed on
Apr 22, 1996
Sold by
Not Provided
Bought by
Bardwell James E and Bardwell Alice M
Create a Home Valuation Report for This Property
The Home Valuation Report is an in-depth analysis detailing your home's value as well as a comparison with similar homes in the area
Home Values in the Area
Average Home Value in this Area
Purchase History
| Date | Buyer | Sale Price | Title Company |
|---|---|---|---|
| Lindsey David | $125,000 | Hot Springs Title Co Inc | |
| Lindsey Orie A | $74,696 | Commerce Title & Closing Ser | |
| Indymac Venture Llc | -- | None Available | |
| Bardwell David B | -- | -- | |
| Bardwell David B | -- | -- | |
| Bardwell David B | -- | -- | |
| Bardwell James E | $65,000 | -- |
Source: Public Records
Mortgage History
| Date | Status | Borrower | Loan Amount |
|---|---|---|---|
| Previous Owner | Lindsey Orie A | $102,338 |
Source: Public Records
Tax History Compared to Growth
Tax History
| Year | Tax Paid | Tax Assessment Tax Assessment Total Assessment is a certain percentage of the fair market value that is determined by local assessors to be the total taxable value of land and additions on the property. | Land | Improvement |
|---|---|---|---|---|
| 2025 | $1,015 | $46,220 | $5,100 | $41,120 |
| 2024 | $1,027 | $46,220 | $5,100 | $41,120 |
| 2023 | $1,036 | $46,220 | $5,100 | $41,120 |
| 2022 | $1,469 | $46,220 | $5,100 | $41,120 |
| 2021 | $1,400 | $30,320 | $3,400 | $26,920 |
| 2020 | $1,025 | $30,320 | $3,400 | $26,920 |
| 2019 | $965 | $30,320 | $3,400 | $26,920 |
| 2018 | $965 | $30,320 | $3,400 | $26,920 |
| 2017 | $990 | $30,320 | $3,400 | $26,920 |
| 2016 | $887 | $27,980 | $3,400 | $24,580 |
| 2015 | $1,237 | $27,980 | $3,400 | $24,580 |
| 2014 | $1,236 | $27,980 | $3,400 | $24,580 |
Source: Public Records
Map
Nearby Homes
- 314 Marion Anderson Rd Unit 2
- 314 Marion Anderson Rd Unit 320 Marion Anderson
- 328 S Danna Dr
- 226 Windcrest Cir
- 109 Copper Mountain Loop
- 159 Bledsoe Cir
- Lot 27 Hunterscove Terrace
- 400 Majestic Lodge Rd
- 400 Majestic Lodge Rd Unit A&B
- 588 Rock Creek Rd
- 171 Old Oak
- 116 Brookdell Place
- 134 Stonehurst Rd
- 102 Winchester Point
- 122 Durham Loop
- 113 Gloria Rd
- 12 Stonegate Ct
- 58 Stonegate Terrace
- 209 Morland Ct
- 7 Stonegate Ln
- 115 Mossman St
- 112 Sycamore St
- 111 Mossman St
- 102 Sandstone St
- 121 Sycamore St
- 117 Sycamore St
- 100 Sandstone St
- 0 Sandstone Unit 15033036
- 108 Sycamore St
- 113 Sycamore St
- 109 Mossman St
- 109 Sycamore St
- 104 Sycamore St
- 0 Mossman Unit 17015127
- 0 Mossman Unit 17015163
- 105 Mossman St
- 158 Marion Anderson Rd
- 105 Sycamore St
- 108 Mossman St
- 100 Sycamore St