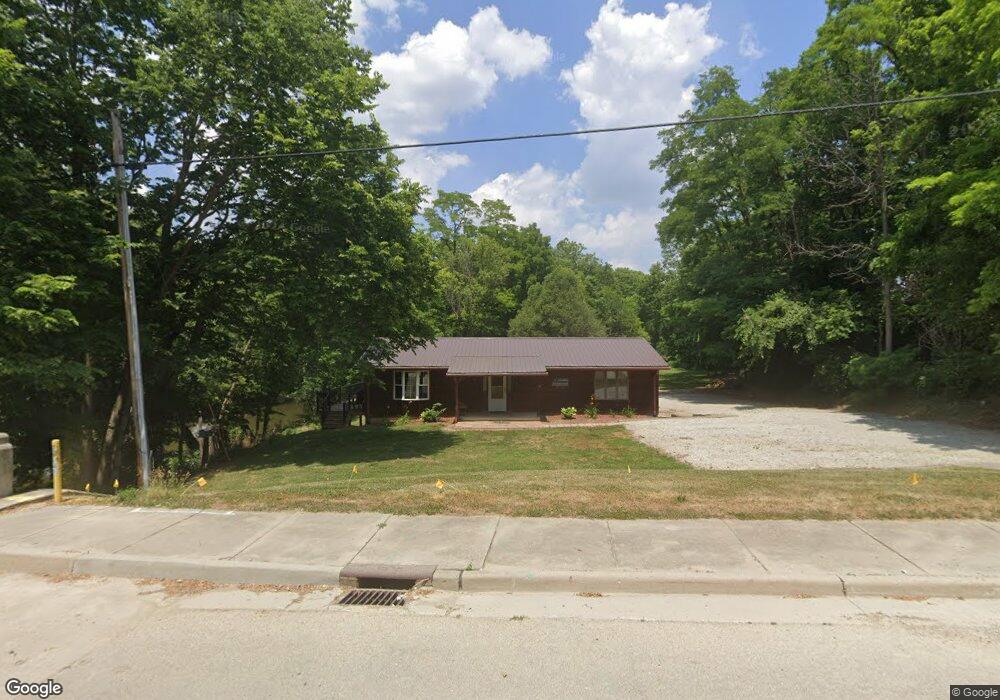
120 W Bridge St Covington, OH 45318
Estimated Value: $173,000 - $188,000
3
Beds
2
Baths
1,248
Sq Ft
$144/Sq Ft
Est. Value
About This Home
This home is located at 120 W Bridge St, Covington, OH 45318 and is currently estimated at $180,303, approximately $144 per square foot. 120 W Bridge St is a home located in Miami County with nearby schools including Covington Elementary/Junior High School, Covington Junior High School, and Covington High School.
Ownership History
Date
Name
Owned For
Owner Type
Purchase Details
Closed on
Apr 8, 2016
Sold by
Kelch Lance and Kelch Tracey
Bought by
Lance Kelch Properties Llc
Current Estimated Value
Purchase Details
Closed on
May 20, 2010
Sold by
Federal Home Loan Mortgage Corporation
Bought by
Kelch Lance
Purchase Details
Closed on
Jan 21, 2010
Sold by
Jackson Bruce D
Bought by
Federal Home Loan Mortgage Corp
Purchase Details
Closed on
Jan 23, 2006
Sold by
Jackson Bridget L
Bought by
Jackson Bruce D
Purchase Details
Closed on
May 1, 1988
Bought by
Duffey Deborah Lee
Create a Home Valuation Report for This Property
The Home Valuation Report is an in-depth analysis detailing your home's value as well as a comparison with similar homes in the area
Home Values in the Area
Average Home Value in this Area
Purchase History
| Date | Buyer | Sale Price | Title Company |
|---|---|---|---|
| Lance Kelch Properties Llc | -- | Attorney | |
| Kelch Lance | $40,500 | -- | |
| Federal Home Loan Mortgage Corp | $36,000 | -- | |
| Jackson Bruce D | -- | -- | |
| Duffey Deborah Lee | $5,000 | -- |
Source: Public Records
Tax History
| Year | Tax Paid | Tax Assessment Tax Assessment Total Assessment is a certain percentage of the fair market value that is determined by local assessors to be the total taxable value of land and additions on the property. | Land | Improvement |
|---|---|---|---|---|
| 2025 | $2,045 | $61,220 | $14,670 | $46,550 |
| 2024 | $2,045 | $46,840 | $13,200 | $33,640 |
| 2023 | $1,794 | $46,840 | $13,200 | $33,640 |
| 2022 | $1,790 | $46,840 | $13,200 | $33,640 |
| 2021 | $1,485 | $36,020 | $10,150 | $25,870 |
| 2020 | $1,489 | $36,020 | $10,150 | $25,870 |
| 2019 | $1,495 | $36,020 | $10,150 | $25,870 |
| 2018 | $1,167 | $28,040 | $5,600 | $22,440 |
| 2017 | $1,188 | $28,040 | $5,600 | $22,440 |
| 2016 | $1,146 | $28,040 | $5,600 | $22,440 |
| 2015 | $1,056 | $26,950 | $5,390 | $21,560 |
| 2014 | $1,056 | $26,950 | $5,390 | $21,560 |
| 2013 | $1,016 | $26,950 | $5,390 | $21,560 |
Source: Public Records
Map
Nearby Homes
Your Personal Tour Guide
Ask me questions while you tour the home.