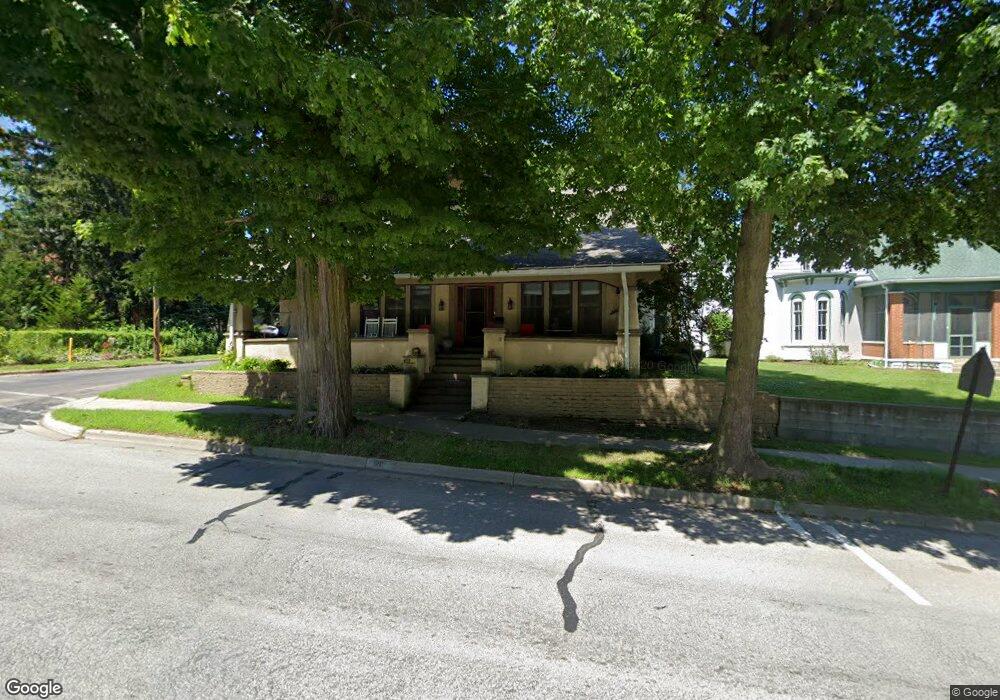
120 W Front St Buchanan, MI 49107
Estimated Value: $264,109 - $324,000
5
Beds
2
Baths
2,748
Sq Ft
$106/Sq Ft
Est. Value
About This Home
This home is located at 120 W Front St, Buchanan, MI 49107 and is currently estimated at $292,027, approximately $106 per square foot. 120 W Front St is a home located in Berrien County with nearby schools including Ottawa Elementary School, Moccasin Elementary School, and Buchanan Middle School.
Ownership History
Date
Name
Owned For
Owner Type
Purchase Details
Closed on
Sep 4, 2009
Sold by
Custom Home Buyers Llc
Bought by
Brackett Phillip R and Brackett Jennifer S
Current Estimated Value
Home Financials for this Owner
Home Financials are based on the most recent Mortgage that was taken out on this home.
Original Mortgage
$134,211
Outstanding Balance
$88,130
Interest Rate
5.27%
Mortgage Type
New Conventional
Estimated Equity
$203,897
Purchase Details
Closed on
Mar 8, 2007
Sold by
Taylor Brian K and Taylor Jennifer L
Bought by
Federal Home Loan Mortgage Corp
Purchase Details
Closed on
Oct 24, 2003
Sold by
Taylor Theresa D
Bought by
Taylor Brian K
Purchase Details
Closed on
Apr 6, 2000
Purchase Details
Closed on
Sep 1, 1975
Create a Home Valuation Report for This Property
The Home Valuation Report is an in-depth analysis detailing your home's value as well as a comparison with similar homes in the area
Home Values in the Area
Average Home Value in this Area
Purchase History
| Date | Buyer | Sale Price | Title Company |
|---|---|---|---|
| Brackett Phillip R | $131,580 | Chicago Title | |
| Federal Home Loan Mortgage Corp | $149,244 | None Available | |
| Taylor Brian K | -- | -- | |
| -- | $117,000 | -- | |
| -- | $14,500 | -- |
Source: Public Records
Mortgage History
| Date | Status | Borrower | Loan Amount |
|---|---|---|---|
| Open | Brackett Phillip R | $134,211 |
Source: Public Records
Tax History
| Year | Tax Paid | Tax Assessment Tax Assessment Total Assessment is a certain percentage of the fair market value that is determined by local assessors to be the total taxable value of land and additions on the property. | Land | Improvement |
|---|---|---|---|---|
| 2025 | $2,782 | $116,800 | $0 | $0 |
| 2024 | $2,586 | $101,700 | $0 | $0 |
| 2023 | $2,495 | $89,500 | $0 | $0 |
| 2022 | $2,447 | $76,700 | $0 | $0 |
| 2021 | $2,560 | $71,000 | $2,900 | $68,100 |
| 2020 | $2,526 | $71,500 | $0 | $0 |
| 2019 | $2,480 | $67,900 | $2,300 | $65,600 |
| 2018 | $2,443 | $67,900 | $0 | $0 |
| 2017 | $2,396 | $67,700 | $0 | $0 |
| 2016 | $2,379 | $67,000 | $0 | $0 |
| 2015 | $2,375 | $63,800 | $0 | $0 |
| 2014 | $2,154 | $60,600 | $0 | $0 |
Source: Public Records
Map
Nearby Homes
- 202 Moccasin St
- 117 Charles Ct
- 401 W 3rd St
- 315 N Red Bud Trail
- 125 S Cayuga St
- 103 W Smith St
- 314 Chippewa St
- 704 Ottawa Ct
- 903 N Detroit St
- 415 Remus Dr
- 801 W Front St
- 4047 Wildon Ct
- 1005 E Front St
- 802 Carrol St
- 1025 E Front St
- 426 Elizabeth St
- 0 E River Rd
- V/L Mead Rd
- 15165 Main St
- 15326 Madron Lake Rd
- 118 W Front St
- 202 W Front St
- 105 Moccasin St
- 108 Moccasin St
- 114 W Front St
- 107 Moccasin St
- 204 W Front St
- 111 W Dewey St
- 109 W Dewey St
- 109 Moccasin St
- 201 W Front St
- 113 W Dewey St
- 206 W Front St
- 119 W Front St
- 107 W Dewey St
- 203 W Front St
- 111 Moccasin St
- 205 W Front St
- 105 W Dewey St
- 105 Theoda Ct
Your Personal Tour Guide
Ask me questions while you tour the home.