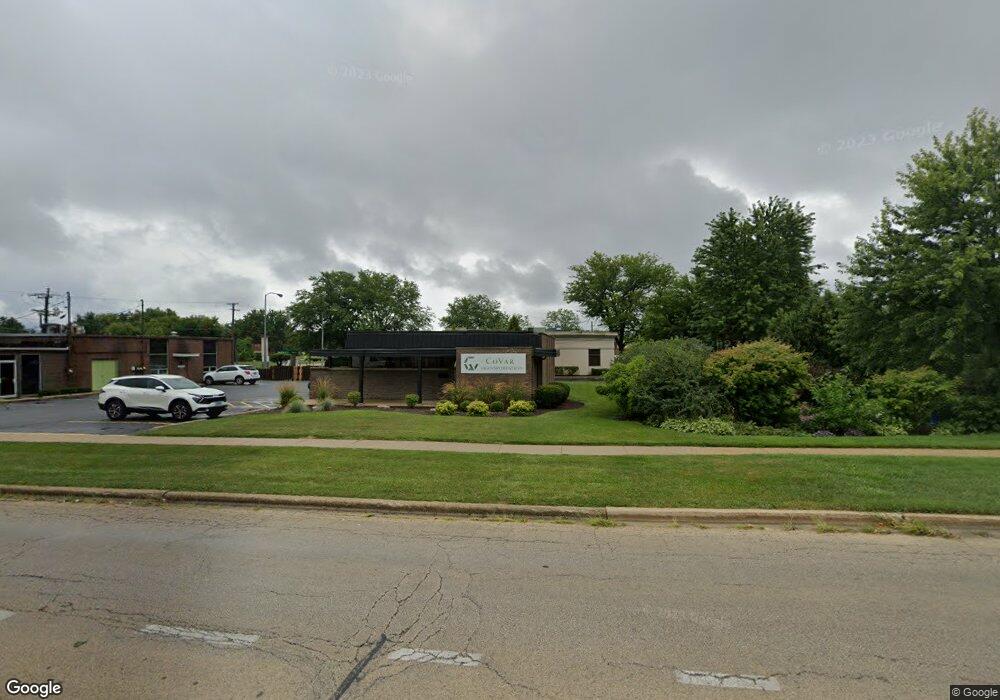
120 W Hillcrest Dr Dekalb, IL 60115
Estimated Value: $236,611
--
Bed
--
Bath
1,840
Sq Ft
$129/Sq Ft
Est. Value
About This Home
This home is located at 120 W Hillcrest Dr, Dekalb, IL 60115 and is currently estimated at $236,611, approximately $128 per square foot. 120 W Hillcrest Dr is a home located in DeKalb County with nearby schools including Jefferson Elementary School, Clinton Rosette Middle School, and De Kalb High School.
Ownership History
Date
Name
Owned For
Owner Type
Purchase Details
Closed on
Aug 16, 2024
Sold by
Covar Properties Llc
Bought by
Robles Valentino A
Current Estimated Value
Home Financials for this Owner
Home Financials are based on the most recent Mortgage that was taken out on this home.
Original Mortgage
$176,000
Outstanding Balance
$171,328
Interest Rate
6.77%
Mortgage Type
Credit Line Revolving
Estimated Equity
$65,283
Purchase Details
Closed on
Apr 29, 2022
Sold by
Cole Transportation Inc
Bought by
Cole Brett A and Cole John A
Purchase Details
Closed on
Apr 18, 2022
Sold by
Cole Brett A
Bought by
Covar Properties Llc
Purchase Details
Closed on
May 28, 2021
Sold by
Trust No 101 and Trust No 102
Bought by
Covar Transportation
Purchase Details
Closed on
May 25, 2021
Sold by
Lindhart Charles D and Lindhart Ruth Y
Bought by
Cole Transportation Inc and Cover Transportation
Create a Home Valuation Report for This Property
The Home Valuation Report is an in-depth analysis detailing your home's value as well as a comparison with similar homes in the area
Home Values in the Area
Average Home Value in this Area
Purchase History
| Date | Buyer | Sale Price | Title Company |
|---|---|---|---|
| Robles Valentino A | $220,000 | None Listed On Document | |
| Cole Brett A | -- | Huck Bouma Pc | |
| Covar Properties Llc | -- | Huck Houma Pc | |
| Covar Transportation | $115,000 | None Listed On Document | |
| Cole Transportation Inc | $115,000 | Attorney |
Source: Public Records
Mortgage History
| Date | Status | Borrower | Loan Amount |
|---|---|---|---|
| Open | Robles Valentino A | $176,000 |
Source: Public Records
Tax History Compared to Growth
Tax History
| Year | Tax Paid | Tax Assessment Tax Assessment Total Assessment is a certain percentage of the fair market value that is determined by local assessors to be the total taxable value of land and additions on the property. | Land | Improvement |
|---|---|---|---|---|
| 2024 | $6,070 | $73,954 | $22,524 | $51,430 |
| 2023 | $6,070 | $64,482 | $19,639 | $44,843 |
| 2022 | $5,949 | $58,871 | $17,930 | $40,941 |
| 2021 | $6,110 | $55,216 | $16,817 | $38,399 |
| 2020 | $6,248 | $54,336 | $16,549 | $37,787 |
| 2019 | $6,126 | $52,201 | $15,899 | $36,302 |
| 2018 | $6,342 | $53,469 | $18,398 | $35,071 |
| 2017 | $6,402 | $51,397 | $17,685 | $33,712 |
| 2016 | $6,331 | $50,100 | $17,239 | $32,861 |
| 2015 | -- | $45,987 | $16,334 | $29,653 |
| 2014 | -- | $46,578 | $16,544 | $30,034 |
| 2013 | -- | $48,926 | $17,378 | $31,548 |
Source: Public Records
Map
Nearby Homes
- 717 N 1st St
- 312 Fairmont Dr
- 124 Tilton Park Dr
- 125 Tilton Park Dr
- 437 W Hillcrest Dr
- 911 N 9th St
- 225 Delcy Dr
- 950 Sycamore Rd
- 828 N 9th St
- 845 N 10th St
- 114 Joanne Ln
- 230 Augusta Ave
- 305 College Ave
- 827 N 11th St
- 345 Augusta Ave
- 322 College Ave
- 336 College Ave
- 214 College Ave
- 227 W Locust St
- 223 W Locust St
- 1030 Sunnymeade Trail
- 1021 N 1st St
- 1017 N 1st St
- 1024 Sunnymeade Trail
- 129 W Hillcrest Dr
- 901 N 1st St
- 901 N 1st St Unit 13
- 901 N 1st St Unit 9
- 901 N 1st St Unit 3
- 1018 Sunnymeade Trail
- 1101 N 1st St
- 209 W Hillcrest Dr
- 1012 Sunnymeade Trail
- 1025 Sunnymeade Trail
- 1120 Sunnymeade Trail
- 1111 N 1st St
- 1111 N 1st St Unit 1111
- 1109 N 1st St
- 1115 Sunnymeade Trail
- 1006 Sunnymeade Trail