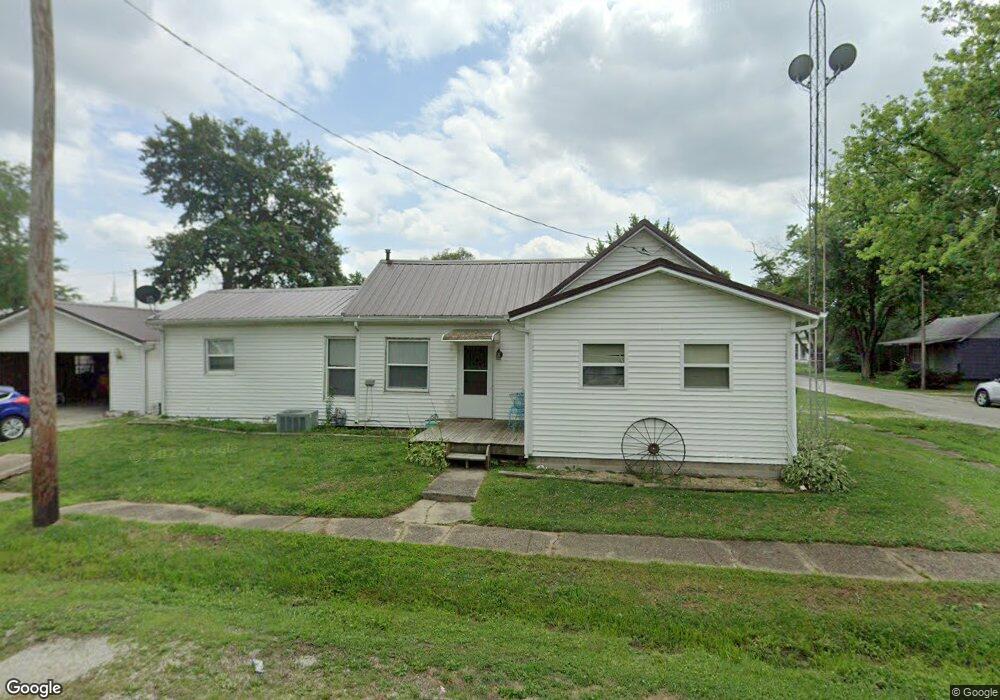
120 W Walnut St Fillmore, IL 62032
Estimated Value: $64,000 - $188,000
--
Bed
--
Bath
--
Sq Ft
0.32
Acres
About This Home
This home is located at 120 W Walnut St, Fillmore, IL 62032 and is currently estimated at $106,561. 120 W Walnut St is a home with nearby schools including North Elementary School and Nokomis Junior/Senior High School.
Ownership History
Date
Name
Owned For
Owner Type
Purchase Details
Closed on
Mar 23, 2023
Sold by
Meyer Nathan
Bought by
Boliard Donavan
Current Estimated Value
Home Financials for this Owner
Home Financials are based on the most recent Mortgage that was taken out on this home.
Original Mortgage
$47,500
Outstanding Balance
$45,870
Interest Rate
5.63%
Mortgage Type
New Conventional
Estimated Equity
$60,691
Purchase Details
Closed on
Jan 8, 2015
Sold by
Carlock Ethan L and Carlock Makenzie
Bought by
Meyer Nathan
Home Financials for this Owner
Home Financials are based on the most recent Mortgage that was taken out on this home.
Original Mortgage
$31,000
Interest Rate
3.25%
Mortgage Type
New Conventional
Purchase Details
Closed on
Jul 15, 2011
Sold by
Beeson John G and Beeson Sally A
Bought by
Carlock Ethan L
Home Financials for this Owner
Home Financials are based on the most recent Mortgage that was taken out on this home.
Original Mortgage
$32,500
Interest Rate
3.25%
Mortgage Type
Purchase Money Mortgage
Create a Home Valuation Report for This Property
The Home Valuation Report is an in-depth analysis detailing your home's value as well as a comparison with similar homes in the area
Home Values in the Area
Average Home Value in this Area
Purchase History
| Date | Buyer | Sale Price | Title Company |
|---|---|---|---|
| Boliard Donavan | $55,000 | Spears Title | |
| Meyer Nathan | $32,000 | -- | |
| Carlock Ethan L | $35,000 | None Available |
Source: Public Records
Mortgage History
| Date | Status | Borrower | Loan Amount |
|---|---|---|---|
| Open | Boliard Donavan | $47,500 | |
| Previous Owner | Meyer Nathan | $31,000 | |
| Previous Owner | Carlock Ethan L | $32,500 |
Source: Public Records
Tax History Compared to Growth
Tax History
| Year | Tax Paid | Tax Assessment Tax Assessment Total Assessment is a certain percentage of the fair market value that is determined by local assessors to be the total taxable value of land and additions on the property. | Land | Improvement |
|---|---|---|---|---|
| 2024 | $1,245 | $13,250 | $1,040 | $12,210 |
| 2023 | $1,189 | $12,450 | $980 | $11,470 |
| 2022 | $1,186 | $12,060 | $950 | $11,110 |
| 2021 | $1,148 | $11,370 | $900 | $10,470 |
| 2020 | $479 | $10,640 | $840 | $9,800 |
| 2019 | $173 | $6,370 | $810 | $5,560 |
| 2018 | $184 | $6,070 | $770 | $5,300 |
| 2017 | $193 | $5,890 | $750 | $5,140 |
| 2016 | $195 | $5,790 | $740 | $5,050 |
| 2015 | $189 | $5,880 | $750 | $5,130 |
| 2013 | $169 | $5,820 | $740 | $5,080 |
Source: Public Records
Map
Nearby Homes
- 000 E 24th Rd
- 456 E 2595 Ave
- 106 Locust St
- 299 E 3050 Ave
- TBD Red Ball Trail
- 102 3rd St
- 0 Sec 29-7-1w Unit MIS25047631
- 171 Red Ball Trail
- 694 E 2735 Ave
- 215 S Pine St
- 425 N Pine St
- 225 E 5th St
- 318 E 5th St
- Three Miles South of Nokomis
- 836 E 2650 Ave
- 1847 Jaketown Rd
- 2672 Us Highway 51
- 5 Remond St
- 0
- 638 E Ford Ave
- 217 N Poplar St
- 204 N Poplar St
- 209 N Poplar St
- 301 N Main St
- 217 N Main St
- 203 N Poplar St
- 114 N Poplar St
- 117 N Main St
- 117 N Poplar St
- 208 N Main St
- 315 N Main St
- 218 N Blaine St
- 221 W Walnut St
- 203 W Walnut St
- 319 E Walnut St
- 308 N Main St
- 316 N Main St
- 2032 N 000 St
- 114 N Blaine St
- 407 N Main St