Estimated Value: $412,377 - $511,000
7
Beds
4
Baths
3,054
Sq Ft
$154/Sq Ft
Est. Value
About This Home
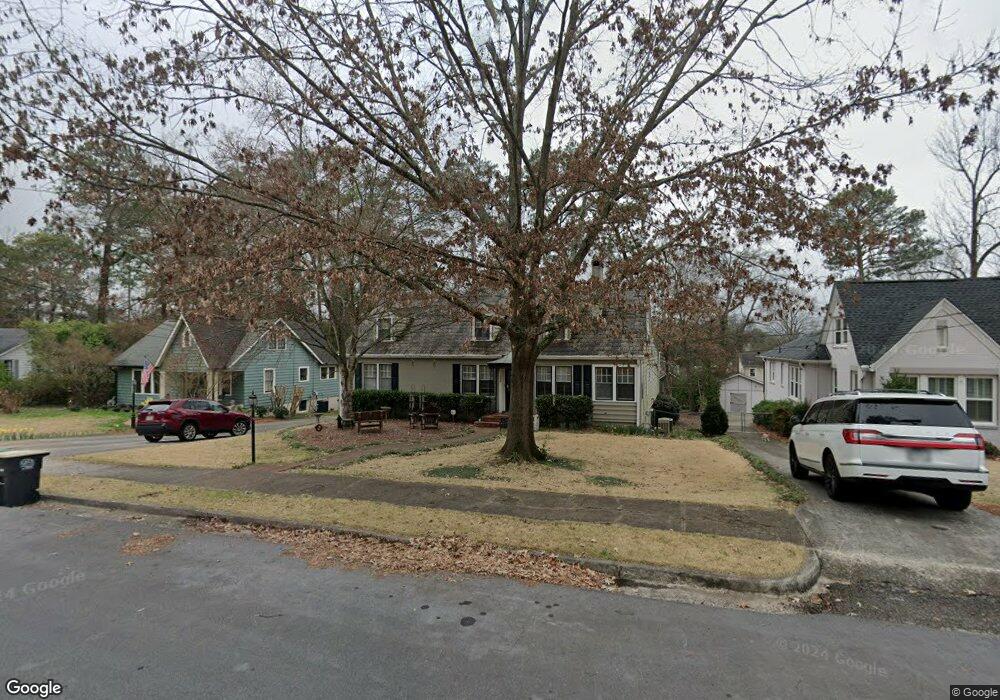
This home is located at 120 Westmore Rd SW, Rome, GA 30165 and is currently estimated at $469,344, approximately $153 per square foot. 120 Westmore Rd SW is a home located in Floyd County with nearby schools including Rome High School, St. Mary School, and Darlington School.
Ownership History
Date
Name
Owned For
Owner Type
Purchase Details
Closed on
May 16, 2002
Sold by
Gallagher Mark R and Catherine Adams Galla
Bought by
Yeargan Victor Bowles and Yeargan Leann D
Current Estimated Value
Purchase Details
Closed on
Sep 1, 1998
Sold by
Minor Minor R and Minor Sara-Ellen M
Bought by
Gallagher Mark R and Catherine Adams
Purchase Details
Closed on
Apr 1, 1993
Sold by
Hain Lawrence P and Hain Donna J
Bought by
Minor Minor R and Minor Sara-Ellen M
Purchase Details
Closed on
Mar 27, 1989
Sold by
Adams Walter R and Adams Laura J
Bought by
Hain Lawrence P and Hain Donna J
Purchase Details
Closed on
Dec 3, 1987
Sold by
Yeargan Hilary Yeargan and Alice Yeargan J
Bought by
Adams Walter R and Adams Laura J
Purchase Details
Closed on
Feb 23, 1982
Sold by
Yeargan V B
Bought by
Yeargan Hilary Yeargan and Alice Year
Purchase Details
Closed on
Dec 22, 1936
Bought by
Yeargan V B
Create a Home Valuation Report for This Property
The Home Valuation Report is an in-depth analysis detailing your home's value as well as a comparison with similar homes in the area
Home Values in the Area
Average Home Value in this Area
Purchase History
| Date | Buyer | Sale Price | Title Company |
|---|---|---|---|
| Yeargan Victor Bowles | $260,000 | -- | |
| Gallagher Mark R | $182,500 | -- | |
| Minor Minor R | $150,000 | -- | |
| Hain Lawrence P | $142,000 | -- | |
| Adams Walter R | $100,000 | -- | |
| Yeargan Hilary Yeargan | -- | -- | |
| Yeargan V B | -- | -- |
Source: Public Records
Tax History Compared to Growth
Tax History
| Year | Tax Paid | Tax Assessment Tax Assessment Total Assessment is a certain percentage of the fair market value that is determined by local assessors to be the total taxable value of land and additions on the property. | Land | Improvement |
|---|---|---|---|---|
| 2024 | $4,259 | $149,113 | $13,596 | $135,517 |
| 2023 | $4,225 | $161,926 | $12,360 | $149,566 |
| 2022 | $4,105 | $134,731 | $10,197 | $124,534 |
| 2021 | $3,994 | $124,531 | $7,725 | $116,806 |
| 2020 | $4,026 | $124,531 | $7,725 | $116,806 |
| 2019 | $3,368 | $124,531 | $7,725 | $116,806 |
| 2018 | $3,966 | $123,401 | $7,725 | $115,676 |
| 2017 | $3,818 | $114,850 | $7,725 | $107,125 |
| 2016 | $3,780 | $112,040 | $7,720 | $104,320 |
| 2015 | $3,569 | $112,014 | $7,720 | $104,294 |
| 2014 | $3,569 | $112,014 | $7,720 | $104,294 |
Source: Public Records
Map
Nearby Homes
- 17 Rosewood Rd SW
- 209 Sherwood Rd SW
- 19 Berckman Ln SW
- 9 Shorter Cir SW
- 3 Berckman Ln SW
- 14 Berckman Ln SW
- 13 Ridgewood Rd SW
- 0 Mount Alto Rd SW Unit 10523740
- 8 S Hughes St SW
- 6 Horseleg Creek Rd SW
- 16 Wilkerson Rd SW
- 17 Wilkerson Rd SW
- 0 Unbridled Rd Unit 22 23074684
- 124 Sheridan Dr NW
- 2 Wayne St SW
- 23 Sweetspire Dr NW
- 21 Sweetspire Dr NW
- 4 Wayne St SW
- 50 Melton Ave SW
- 1005 N 2nd Ave NW Unit 39
- 122 Westmore Rd SW
- 118 Westmore Rd SW Unit 69
- 116 Westmore Rd SW
- 124 Westmore Rd SW
- 124 Westmore Rd SW
- 19 Rosewood Rd SW
- 15 Rosewood Rd SW
- 114 Westmore Rd SW
- 119 Westmore Rd SW
- 121 Westmore Rd SW
- 13 Rosewood Rd SW
- 115 Westmore Rd SW
- 115 Westmore Rd SW
- 23 Rosewood Rd SW
- 123 Westmore Rd SW
- 11 Rosewood Rd SW
- 112 Westmore Rd SW
- 0 Rosewood Rd SW Unit 7194636
- 0 Rosewood Rd SW Unit 7036217
- 0 Rosewood Rd SW Unit 3234102