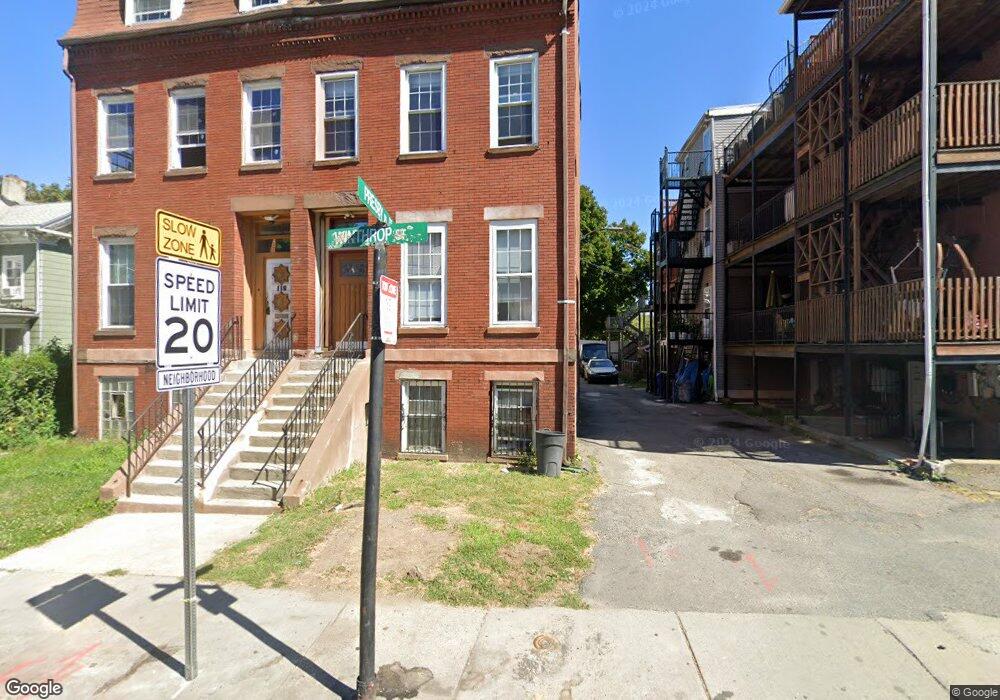
120 Winthrop St Roxbury, MA 02119
Sav-Mor NeighborhoodEstimated Value: $799,000 - $1,021,000
3
Beds
3
Baths
1,890
Sq Ft
$484/Sq Ft
Est. Value
About This Home
This home is located at 120 Winthrop St, Roxbury, MA 02119 and is currently estimated at $914,667, approximately $483 per square foot. 120 Winthrop St is a home located in Suffolk County with nearby schools including Dudley Street Neighborhood Charter School and City on a Hill Charter Public School.
Ownership History
Date
Name
Owned For
Owner Type
Purchase Details
Closed on
Jan 31, 2011
Sold by
Fnma
Bought by
Alden Eric
Current Estimated Value
Home Financials for this Owner
Home Financials are based on the most recent Mortgage that was taken out on this home.
Original Mortgage
$247,000
Outstanding Balance
$169,417
Interest Rate
4.83%
Mortgage Type
Purchase Money Mortgage
Estimated Equity
$745,250
Purchase Details
Closed on
Mar 31, 2009
Sold by
Pettie Anthony D
Bought by
Federal National Mortgage Association
Create a Home Valuation Report for This Property
The Home Valuation Report is an in-depth analysis detailing your home's value as well as a comparison with similar homes in the area
Home Values in the Area
Average Home Value in this Area
Purchase History
| Date | Buyer | Sale Price | Title Company |
|---|---|---|---|
| Alden Eric | $200,000 | -- | |
| Federal National Mortgage Association | $433,387 | -- |
Source: Public Records
Mortgage History
| Date | Status | Borrower | Loan Amount |
|---|---|---|---|
| Open | Alden Eric | $247,000 |
Source: Public Records
Tax History Compared to Growth
Tax History
| Year | Tax Paid | Tax Assessment Tax Assessment Total Assessment is a certain percentage of the fair market value that is determined by local assessors to be the total taxable value of land and additions on the property. | Land | Improvement |
|---|---|---|---|---|
| 2025 | $5,705 | $492,700 | $133,400 | $359,300 |
| 2024 | $4,773 | $437,900 | $117,800 | $320,100 |
| 2023 | $4,479 | $417,000 | $112,200 | $304,800 |
| 2022 | $4,320 | $397,100 | $106,800 | $290,300 |
| 2021 | $3,923 | $367,700 | $98,900 | $268,800 |
| 2020 | $3,709 | $351,200 | $87,600 | $263,600 |
| 2019 | $3,285 | $311,700 | $63,000 | $248,700 |
| 2018 | $3,025 | $288,600 | $63,000 | $225,600 |
| 2017 | $3,056 | $288,600 | $63,000 | $225,600 |
| 2016 | $2,761 | $251,000 | $63,000 | $188,000 |
| 2015 | $2,583 | $213,300 | $66,900 | $146,400 |
| 2014 | $2,505 | $199,100 | $66,900 | $132,200 |
Source: Public Records
Map
Nearby Homes
- 108 Mount Pleasant Ave Unit 108R
- 101 Mount Pleasant Ave
- 80 Blue Hill Ave Unit 5
- 24 Clarence St Unit 24R
- 33 Copeland Park Unit C
- 45 Woodville St
- 7 Langford Park Unit 3
- 119 Blue Hill Ave
- 59 Perrin St
- 59 Perrin St Unit 1
- 22 Alaska St
- 79 W Cottage St
- 31 Alaska St
- 133 Blue Hill Ave
- 30 Copeland St Unit 1
- Lot 84 Blue Hill Ave
- 2 Mount Pleasant Place Unit 2
- 20 Rockville Park
- 22 Rockville Park
- 21 Dean St
- 118 Winthrop St Unit 3
- 118 Winthrop St Unit 2
- 1 Presby Place
- 45 Blue Hill Ave
- 43 Blue Hill Ave
- 43 Blue Hill Ave Unit 3
- 43 Blue Hill Ave Unit 1
- 47 Blue Hill Ave
- 41 Blue Hill Ave
- 41 Blue Hill Ave Unit 1
- 41 Blue Hill Ave Unit A
- 39 Blue Hill Ave
- 3 Presby Place
- 3 Presby Place
- 3 Presby Place Unit 1
- 3 Presby Place Unit 2
- 3 Presby Place Unit 3
- 3 Presby Place Unit One
- 114 Winthrop St
- 37 Blue Hill Ave